如何在R中执行类似Excel中的vlookup和填充下拉操作?

95

我有一个包含105000行和30列的数据集。我有一个分类变量,希望将其分配为一个数字。在Excel中,我可能会使用VLOOKUP并填充某些内容。

R中如何实现同样的功能呢?

基本上,我有一个HouseType变量,我需要计算HouseTypeNo。以下是一些样本数据:

HouseType HouseTypeNo
Semi            1
Single          2
Row             3
Single          2
Apartment       4
Apartment       4
Row             3
9个回答

134

如果我正确理解了您的问题,这里有四种方法可以使用 R 做类似于 Excel 的 VLOOKUP 并向下填充的操作:

# load sample data from Q
hous <- read.table(header = TRUE, 
                   stringsAsFactors = FALSE, 
text="HouseType HouseTypeNo
Semi            1
Single          2
Row             3
Single          2
Apartment       4
Apartment       4
Row             3")

# create a toy large table with a 'HouseType' column 
# but no 'HouseTypeNo' column (yet)
largetable <- data.frame(HouseType = as.character(sample(unique(hous$HouseType), 1000, replace = TRUE)), stringsAsFactors = FALSE)

# create a lookup table to get the numbers to fill
# the large table
lookup <- unique(hous)
  HouseType HouseTypeNo
1      Semi           1
2    Single           2
3       Row           3
5 Apartment           4

这里有四种方法可以使用lookup表中的值来填充largetable中的HouseTypeNo:

第一种是使用基本的merge:

# 1. using base 
base1 <- (merge(lookup, largetable, by = 'HouseType'))

在基础R中使用具名向量的第二种方法:

# 2. using base and a named vector
housenames <- as.numeric(1:length(unique(hous$HouseType)))
names(housenames) <- unique(hous$HouseType)

base2 <- data.frame(HouseType = largetable$HouseType,
                    HouseTypeNo = (housenames[largetable$HouseType]))

第三,使用 plyr 包:

# 3. using the plyr package
library(plyr)
plyr1 <- join(largetable, lookup, by = "HouseType")

第四步,使用sqldf

# 4. using the sqldf package
library(sqldf)
sqldf1 <- sqldf("SELECT largetable.HouseType, lookup.HouseTypeNo
FROM largetable
INNER JOIN lookup
ON largetable.HouseType = lookup.HouseType")

如果可能存在一些在largetable中的房屋类型在lookup中不存在,则应使用左连接:

如果largetable中的某些房屋类型可能不存在于lookup中,则应使用左连接:

sqldf("select * from largetable left join lookup using (HouseType)")

其他解决方案也需要相应的更改。

这是你想要做的吗?让我知道你喜欢哪种方法,我会添加评论。


2
我意识到这有点晚了,但还是谢谢你的帮助。我尝试了第一种和第二种方法。它们都很好用。再次感谢你回答我的问题! - user2142810
1
不客气。如果我的回答解决了你的问题,你可以点击左上角箭头下方的勾来表示确认。这将对其他有同样问题的人有所帮助。 - Ben
2
我认为解决方案#2仅适用于您的示例中唯一值恰好按递增顺序排列(=第一个唯一名称为1,第二个唯一名称为2,依此类推)。如果在第二行中添加“hous”,例如'HousType = ECII',HousTypeNo ='17',查找将出现错误。 - ECII
1
@ECII请继续并添加您的答案,以说明问题并展示您的解决方案。 - Ben
2
很棒的文章。感谢分享!#4对我的应用程序非常有效...可以连接两个非常大的400MB表。 - Nathaniel Payne
显示剩余2条评论

36

我认为您也可以使用match()

largetable$HouseTypeNo <- with(lookup,
                     HouseTypeNo[match(largetable$HouseType,
                                       HouseType)])

如果我打乱lookup的顺序,这仍然有效。


11

我也喜欢使用qdapTools::lookup或简写二进制运算符%l%。它的作用与Excel的vlookup完全相同,但它接受名称参数而不是列号。

## Replicate Ben's data:
hous <- structure(list(HouseType = c("Semi", "Single", "Row", "Single", 
    "Apartment", "Apartment", "Row"), HouseTypeNo = c(1L, 2L, 3L, 
    2L, 4L, 4L, 3L)), .Names = c("HouseType", "HouseTypeNo"), 
    class = "data.frame", row.names = c(NA, -7L))


largetable <- data.frame(HouseType = as.character(sample(unique(hous$HouseType), 
    1000, replace = TRUE)), stringsAsFactors = FALSE)


## It's this simple:
library(qdapTools)
largetable[, 1] %l% hous

9
海报并没有询问“exact=FALSE”时如何查找值,但我会添加此答案作为我的参考和其他人的可能性。
如果您要查找分类值,请使用其他答案。
Excel的“vlookup”还允许您在第4个参数(1)“match=TRUE”处匹配数值近似项。 我认为“match=TRUE”就像在温度计上查找值一样。默认值为FALSE,非常适合分类值。
如果您想要近似匹配(执行查找),R具有一个名为“findInterval”的函数,它(顾名思义)将找到包含连续数字值的间隔/ bin。
然而,假设您要为几个值进行“findInterval”。 您可以编写循环或使用应用程序功能。 但是,我发现采用DIY矢量化方法更有效。
假设您有一个由x和y索引的值网格:
grid <- list(x = c(-87.727, -87.723, -87.719, -87.715, -87.711), 
             y = c(41.836, 41.839, 41.843, 41.847, 41.851), 
             z = (matrix(data = c(-3.428, -3.722, -3.061, -2.554, -2.362, 
                                  -3.034, -3.925, -3.639, -3.357, -3.283, 
                                  -0.152, -1.688, -2.765, -3.084, -2.742, 
                                   1.973,  1.193, -0.354, -1.682, -1.803, 
                                   0.998,  2.863,  3.224,  1.541, -0.044), 
                         nrow = 5, ncol = 5)))

如果你有一些值,想要通过 x 和 y 进行查找:

df <- data.frame(x = c(-87.723, -87.712, -87.726, -87.719, -87.722, -87.722), 
                 y = c(41.84, 41.842, 41.844, 41.849, 41.838, 41.842), 
                 id = c("a", "b", "c", "d", "e", "f")
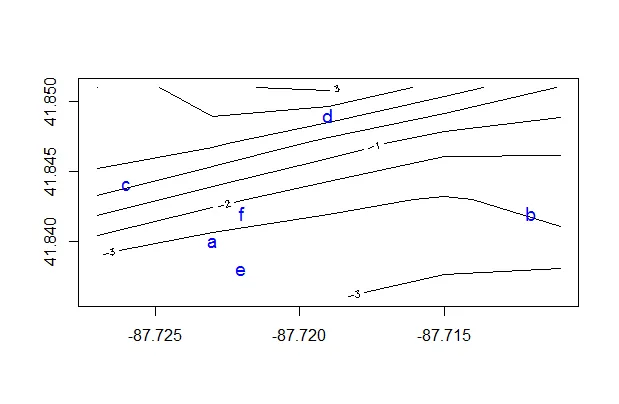
以下是示例可视化结果:

contour(grid)
points(df$x, df$y, pch=df$id, col="blue", cex=1.2)

等高线图

使用以下公式可以找到x轴间隔和y轴间隔:

xrng <- range(grid$x)
xbins <- length(grid$x) -1
yrng <- range(grid$y)
ybins <- length(grid$y) -1
df$ix <- trunc( (df$x - min(xrng)) / diff(xrng) * (xbins)) + 1
df$iy <- trunc( (df$y - min(yrng)) / diff(yrng) * (ybins)) + 1

你可以进一步采用(简单的)插值方法对grid中的z值进行处理,如下所示:
df$z <- with(df, (grid$z[cbind(ix, iy)] + 
                      grid$z[cbind(ix + 1, iy)] +
                      grid$z[cbind(ix, iy + 1)] + 
                      grid$z[cbind(ix + 1, iy + 1)]) / 4)
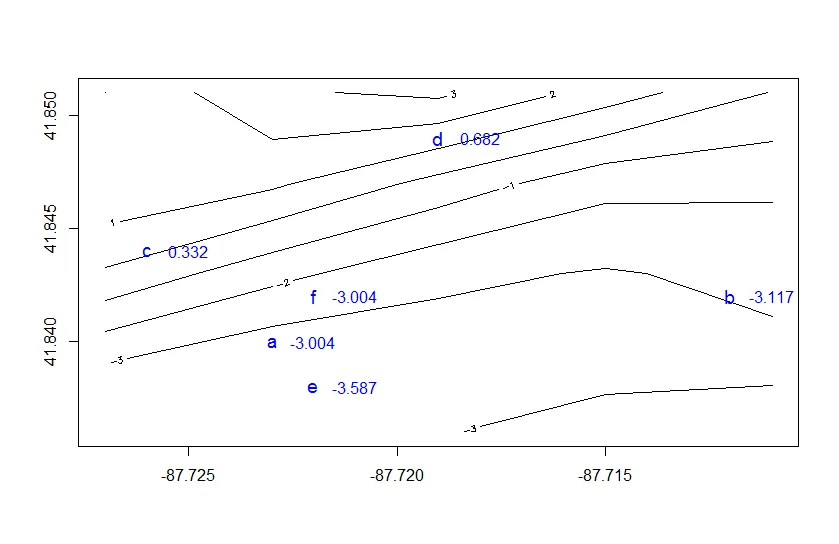
这将给您以下数值:

contour(grid, xlim = range(c(grid$x, df$x)), ylim = range(c(grid$y, df$y)))
points(df$x, df$y, pch=df$id, col="blue", cex=1.2)
text(df$x + .001, df$y, lab=round(df$z, 2), col="blue", cex=1)

Contour plot with values

df
#         x      y id ix iy        z
# 1 -87.723 41.840  a  2  2 -3.00425
# 2 -87.712 41.842  b  4  2 -3.11650
# 3 -87.726 41.844  c  1  3  0.33150
# 4 -87.719 41.849  d  3  4  0.68225
# 6 -87.722 41.838  e  2  1 -3.58675
# 7 -87.722 41.842  f  2  2 -3.00425

请注意,ix和iy也可以使用循环和findInterval来找到,例如下面是第二行的一个示例。
findInterval(df$x[2], grid$x)
# 4
findInterval(df$y[2], grid$y)
# 2

df[2] 中匹配 ixiy

注: (1) vlookup 的第四个参数以前称为 "match",但是在引入功能区后被重命名为 "[range_lookup]"。


6
@Ben的第二种解决方案在其他更通用的示例中无法复现。它在这个示例中恰好给出了正确的查找结果,因为houses中唯一的HouseType按照递增顺序出现。请尝试以下方法:
hous <- read.table(header = TRUE,   stringsAsFactors = FALSE,   text="HouseType HouseTypeNo
  Semi            1
  ECIIsHome       17
  Single          2
  Row             3
  Single          2
  Apartment       4
  Apartment       4
  Row             3")

largetable <- data.frame(HouseType = as.character(sample(unique(hous$HouseType), 1000, replace = TRUE)), stringsAsFactors = FALSE)
lookup <- unique(hous)

本的第二个解决方案提供了以下结果:
housenames <- as.numeric(1:length(unique(hous$HouseType)))
names(housenames) <- unique(hous$HouseType)
base2 <- data.frame(HouseType = largetable$HouseType,
                    HouseTypeNo = (housenames[largetable$HouseType]))

当它

unique(base2$HouseTypeNo[ base2$HouseType=="ECIIsHome" ])
[1] 2

当查找表的正确答案为17时

正确的做法是

 hous <- read.table(header = TRUE,   stringsAsFactors = FALSE,   text="HouseType HouseTypeNo
      Semi            1
      ECIIsHome       17
      Single          2
      Row             3
      Single          2
      Apartment       4
      Apartment       4
      Row             3")

largetable <- data.frame(HouseType = as.character(sample(unique(hous$HouseType), 1000, replace = TRUE)), stringsAsFactors = FALSE)

housenames <- tapply(hous$HouseTypeNo, hous$HouseType, unique)
base2 <- data.frame(HouseType = largetable$HouseType,
  HouseTypeNo = (housenames[largetable$HouseType]))

现在查找已经正确执行。
unique(base2$HouseTypeNo[ base2$HouseType=="ECIIsHome" ])
ECIIsHome 
       17

我试图编辑Ben的回答,但出于我无法理解的原因,它被拒绝了。


5
你可以使用plyr包中的mapvalues()函数。 初始数据:
dat <- data.frame(HouseType = c("Semi", "Single", "Row", "Single", "Apartment", "Apartment", "Row"))

> dat
  HouseType
1      Semi
2    Single
3       Row
4    Single
5 Apartment
6 Apartment
7       Row

查询/对照表:

lookup <- data.frame(type_text = c("Semi", "Single", "Row", "Apartment"), type_num = c(1, 2, 3, 4))
> lookup
  type_text type_num
1      Semi        1
2    Single        2
3       Row        3
4 Apartment        4

创建新变量:

dat$house_type_num <- plyr::mapvalues(dat$HouseType, from = lookup$type_text, to = lookup$type_num)

或者,对于简单的替换,您可以跳过创建长查找表并直接在一步中执行此操作:

dat$house_type_num <- plyr::mapvalues(dat$HouseType,
                                      from = c("Semi", "Single", "Row", "Apartment"),
                                      to = c(1, 2, 3, 4))

结果:

> dat
  HouseType house_type_num
1      Semi              1
2    Single              2
3       Row              3
4    Single              2
5 Apartment              4
6 Apartment              4
7       Row              3

5

从以下开始:

houses <- read.table(text="Semi            1
Single          2
Row             3
Single          2
Apartment       4
Apartment       4
Row             3",col.names=c("HouseType","HouseTypeNo"))

...你可以使用

as.numeric(factor(houses$HouseType))

...为每种房屋类型提供唯一的编号。您可以在此处查看结果:

> houses2 <- data.frame(houses,as.numeric(factor(houses$HouseType)))
> houses2
  HouseType HouseTypeNo as.numeric.factor.houses.HouseType..
1      Semi           1                                    3
2    Single           2                                    4
3       Row           3                                    2
4    Single           2                                    4
5 Apartment           4                                    1
6 Apartment           4                                    1
7       Row           3                                    2

...所以最终你会在行上得到不同的数字(因为因素按字母顺序排序),但是相同的模式。
(编辑:实际上,这个答案中剩下的文本是多余的。我想检查一下,结果发现当houses$HouseType在第一次读入数据框时就已经成为了一个因子)。
然而,你可能更好地将HouseType转换为因子,这将给你所有与HouseTypeNo相同的好处,但更容易解释,因为房屋类型是命名而不是编号的,例如:
> houses3 <- houses
> houses3$HouseType <- factor(houses3$HouseType)
> houses3
  HouseType HouseTypeNo
1      Semi           1
2    Single           2
3       Row           3
4    Single           2
5 Apartment           4
6 Apartment           4
7       Row           3
> levels(houses3$HouseType)
[1] "Apartment" "Row"       "Semi"      "Single"  

4

使用merge与Excel中的查找不同,如果在查找表中没有强制执行主键约束,则有可能会重复(乘以)您的数据,或者如果您没有使用all.x = T,则会减少记录数。

为了确保您安全地进行查找并避免出现问题,我建议采用两种策略。

第一种策略是检查查找键中重复行的数量:

safeLookup <- function(data, lookup, by, select = setdiff(colnames(lookup), by)) {
  # Merges data to lookup making sure that the number of rows does not change.
  stopifnot(sum(duplicated(lookup[, by])) == 0)
  res <- merge(data, lookup[, c(by, select)], by = by, all.x = T)
  return (res)
}

在使用查找数据集之前,您需要进行去重操作:

baseSafe <- safeLookup(largetable, house.ids, by = "HouseType")
# Error: sum(duplicated(lookup[, by])) == 0 is not TRUE 

baseSafe<- safeLookup(largetable, unique(house.ids), by = "HouseType")
head(baseSafe)
# HouseType HouseTypeNo
# 1 Apartment           4
# 2 Apartment           4
# ...

第二个选项是通过从查找数据集中选择第一个匹配值来复制Excel行为:
firstLookup <- function(data, lookup, by, select = setdiff(colnames(lookup), by)) {
  # Merges data to lookup using first row per unique combination in by.
  unique.lookup <- lookup[!duplicated(lookup[, by]), ]
  res <- merge(data, unique.lookup[, c(by, select)], by = by, all.x = T)
  return (res)
}

baseFirst <- firstLookup(largetable, house.ids, by = "HouseType")

这些函数与lookup略有不同,因为它们添加多个列。


2

可以使用 lookup 包来实现:

library(lookup)
# reference data
hous <- data.frame(HouseType=c("Semi","Single","Row","Single","Apartment","Apartment","Row"),
                   HouseTypeNo=c(1,2,3,2,4,4,3))
# new large data with HouseType but no HouseTypeNo
largetable <- data.frame(HouseType = sample(unique(hous$HouseType), 1000, replace = TRUE))

# vector approach
largetable$num1 <- lookup(largetable$HouseType, hous$HouseType, hous$HouseTypeNo)
# dataframe approach
largetable$num2 <- vlookup(largetable$HouseType, hous, "HouseType", "HouseTypeNo")

head(largetable)
#   HouseType num1 num2
# 1      Semi    1    1
# 2      Semi    1    1
# 3 Apartment    4    4
# 4      Semi    1    1
# 5    Single    2    2
# 6    Single    2    2

1
这个解决方案最接近 Excel 实现。 - Soumya Boral

网页内容由stack overflow 提供, 点击上面的
可以查看英文原文,
原文链接