Python - 从字典创建图表

4

我有一个csv文件,格式如下:

起始城市,目的城市,长度,时间

我已经从中提取了数据,并将其转换为字典列表的形式,如下所示:

map_dict = [
  {'start': 'a', 'end': 'b', 'length': 5, 'time': 55},
  {'start': 'a', 'end': 'c', 'length': 8, 'time': 125},
....]

我需要知道如何将这个列表转换成图,以便我可以执行像从一个城市到另一个城市的最短路径、从一个城市到另一个城市的最小边等操作。
请问有人能告诉我如何将我的字典列表转换为带有它们之间边缘的连接图吗?
就像上面的例子中,应该在a-b和a-c之间建立一条边缘。
如果您能提供一个可靠的阅读来源,那将非常有帮助。谢谢。

谷歌搜索得到了这个那个 - Arkistarvh Kltzuonstev
2个回答

4

请查看NetworkX库

在GitHub上:https://github.com/networkx/networkx

使用您的示例并添加一些额外的点,并将时间设置为权重:

import numpy as np
import matplotlib.pyplot as plt

G = nx.Graph()
map_dict = [
            {'start': 'a', 'end': 'b', 'length': 5, 'time': 55},
            {'start': 'a', 'end': 'c', 'length': 8, 'time': 125},
            {'start': 'b', 'end': 'c', 'length': 22, 'time': 275},
            {'start': 'c', 'end': 'd', 'length': 16, 'time': 210},
            {'start': 'b', 'end': 'e', 'length': 22, 'time': 14},
            {'start': 'd', 'end': 'e', 'length': 7, 'time': 6}  ]

for pts in map_dict:
    G.add_edge(pts['start'], pts['end'], weight=pts['time'])

# Show the shortest path between points 'a' and 'e'.
path = nx.shortest_path(G, source='a',target='e')
print(path)

path_edges = zip(path, path[1:])
path_edges = set(path_edges)
pos = nx.spring_layout(G)
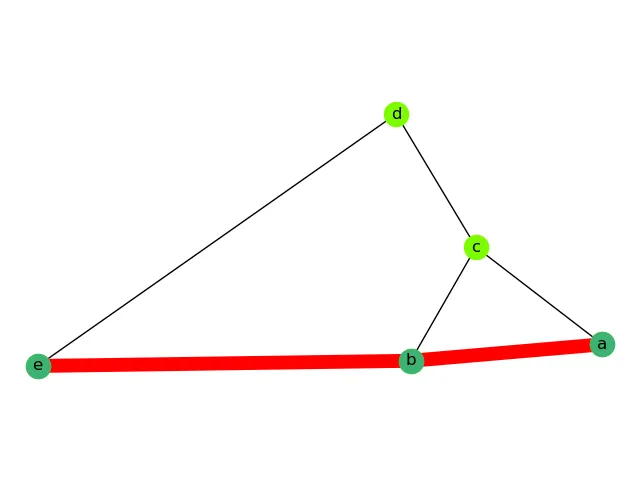
nx.draw(G, pos, node_color='lawngreen', with_labels = True)
nx.draw_networkx_nodes(G, pos, nodelist=path, node_color='mediumseagreen')
nx.draw_networkx_edges(G, pos, edgelist=path_edges, edge_color='r', width=10)
plt.axis('equal')
plt.show()    

输出结果: ['a', 'b', 'e']

这里是图片描述


2
你距离解决方案并不遥远。 首先,考虑如何表示你的图形。一个典型的数据结构是使用节点作为键和节点列表作为值来构建字典(即你的边)。
这是一个简单的代码来实现你想要的功能。转换函数是create_graph_from_map,我添加了一个打印边的函数,以便您可以验证它是否有效。 为简单起见,我使用3元组来表示你的边,但你也可以创建自己的类或使用dict。
map_dict = [
    {'start': 'a', 'end': 'b', 'length': 5, 'time': 55},
    {'start': 'a', 'end': 'c', 'length': 8, 'time': 125},
    {'start': 'b', 'end': 'd', 'length': 10, 'time': 130}
]

def create_graph_from_map(map_dict):
    """convert a dictionary of start/end information into a directed graph"""
    graph = {}
    for info in map_dict:
        start_city = info['start']
        if not start_city in graph:
            graph[start_city] = []
        edge = (info['end'], info['length'], info['time'])
        graph[start_city].append(edge)

    return graph

def show_edges(graph, start_city):
    for edge in graph[start_city]:
        end_city, length, travel_time = edge
        print(F"{start_city} -> {end_city}, length={length}, time={travel_time}")

# main
graph = create_graph_from_map(map_dict)
show_edges(graph, 'a')

这将会打印出来

a -> b, length=5, time=55
a -> c, length=8, time=125

网页内容由stack overflow 提供, 点击上面的
可以查看英文原文,
原文链接