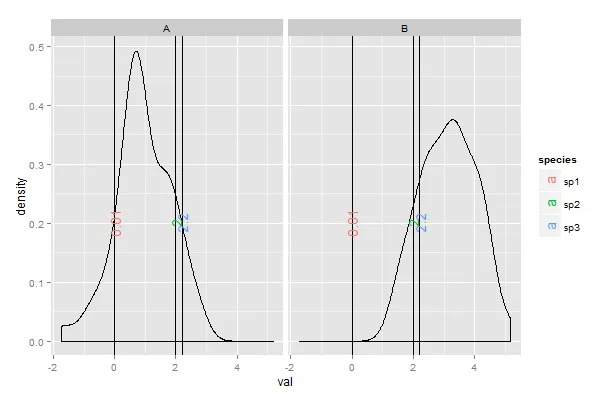
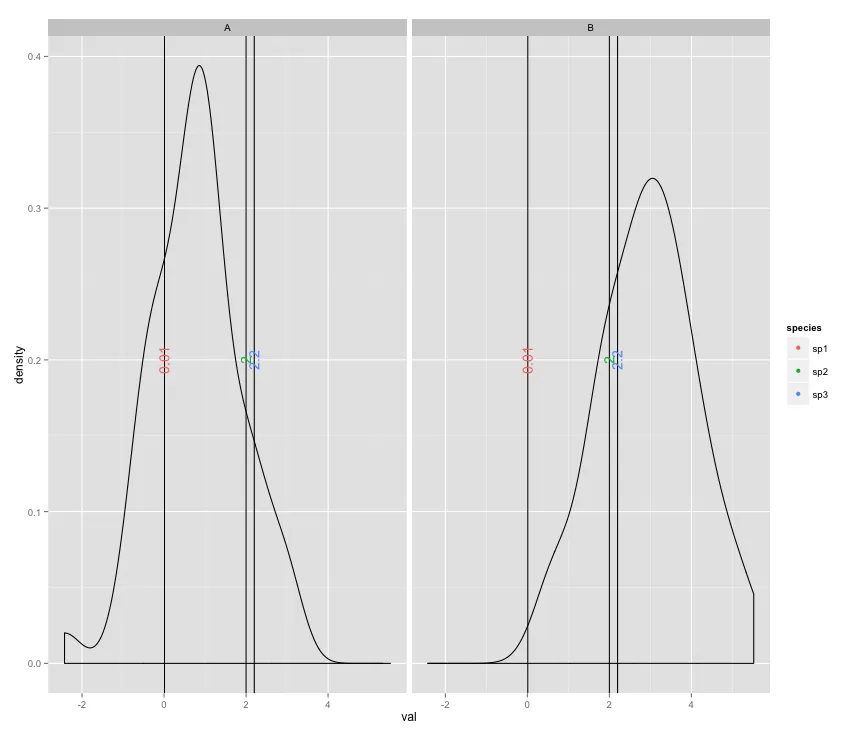
ggplot(majdf, aes(x = val)) +
  geom_point(data = majtxt, aes(x = geq, colour = species),
             y = 0.2, size = 0) +
  geom_density() +
  geom_vline(data = majtxt, aes(xintercept = geq)) +
  geom_text(data = majtxt, aes(x = geq, y = 0.2, label = geq, color = species),
            angle = 90, show_guide = FALSE) +
  facet_wrap(~ lvl) +
  scale_colour_discrete(guide=guide_legend(override.aes=list(size=4)))
如何操作:添加一个点几何图形,并使用适当的颜色映射。这将在图例中添加一个点。但是,为了防止它出现在绘图中,请将点的大小设置为0。在文本几何图形中,告诉它不要将那部分(旋转的a)添加到图例中(show_guide = FALSE)。最后,图例只会显示您想要的点而不是侧向的a;不幸的是,它以与绘图相同的大小绘制,即0。因此,使用guide_legend的override.aes参数(该参数传递给scale_colour_discrete中的guide),将点的大小设置为“大”。
这种方法不需要将组成两个不同的图并将它们拼接在一起。
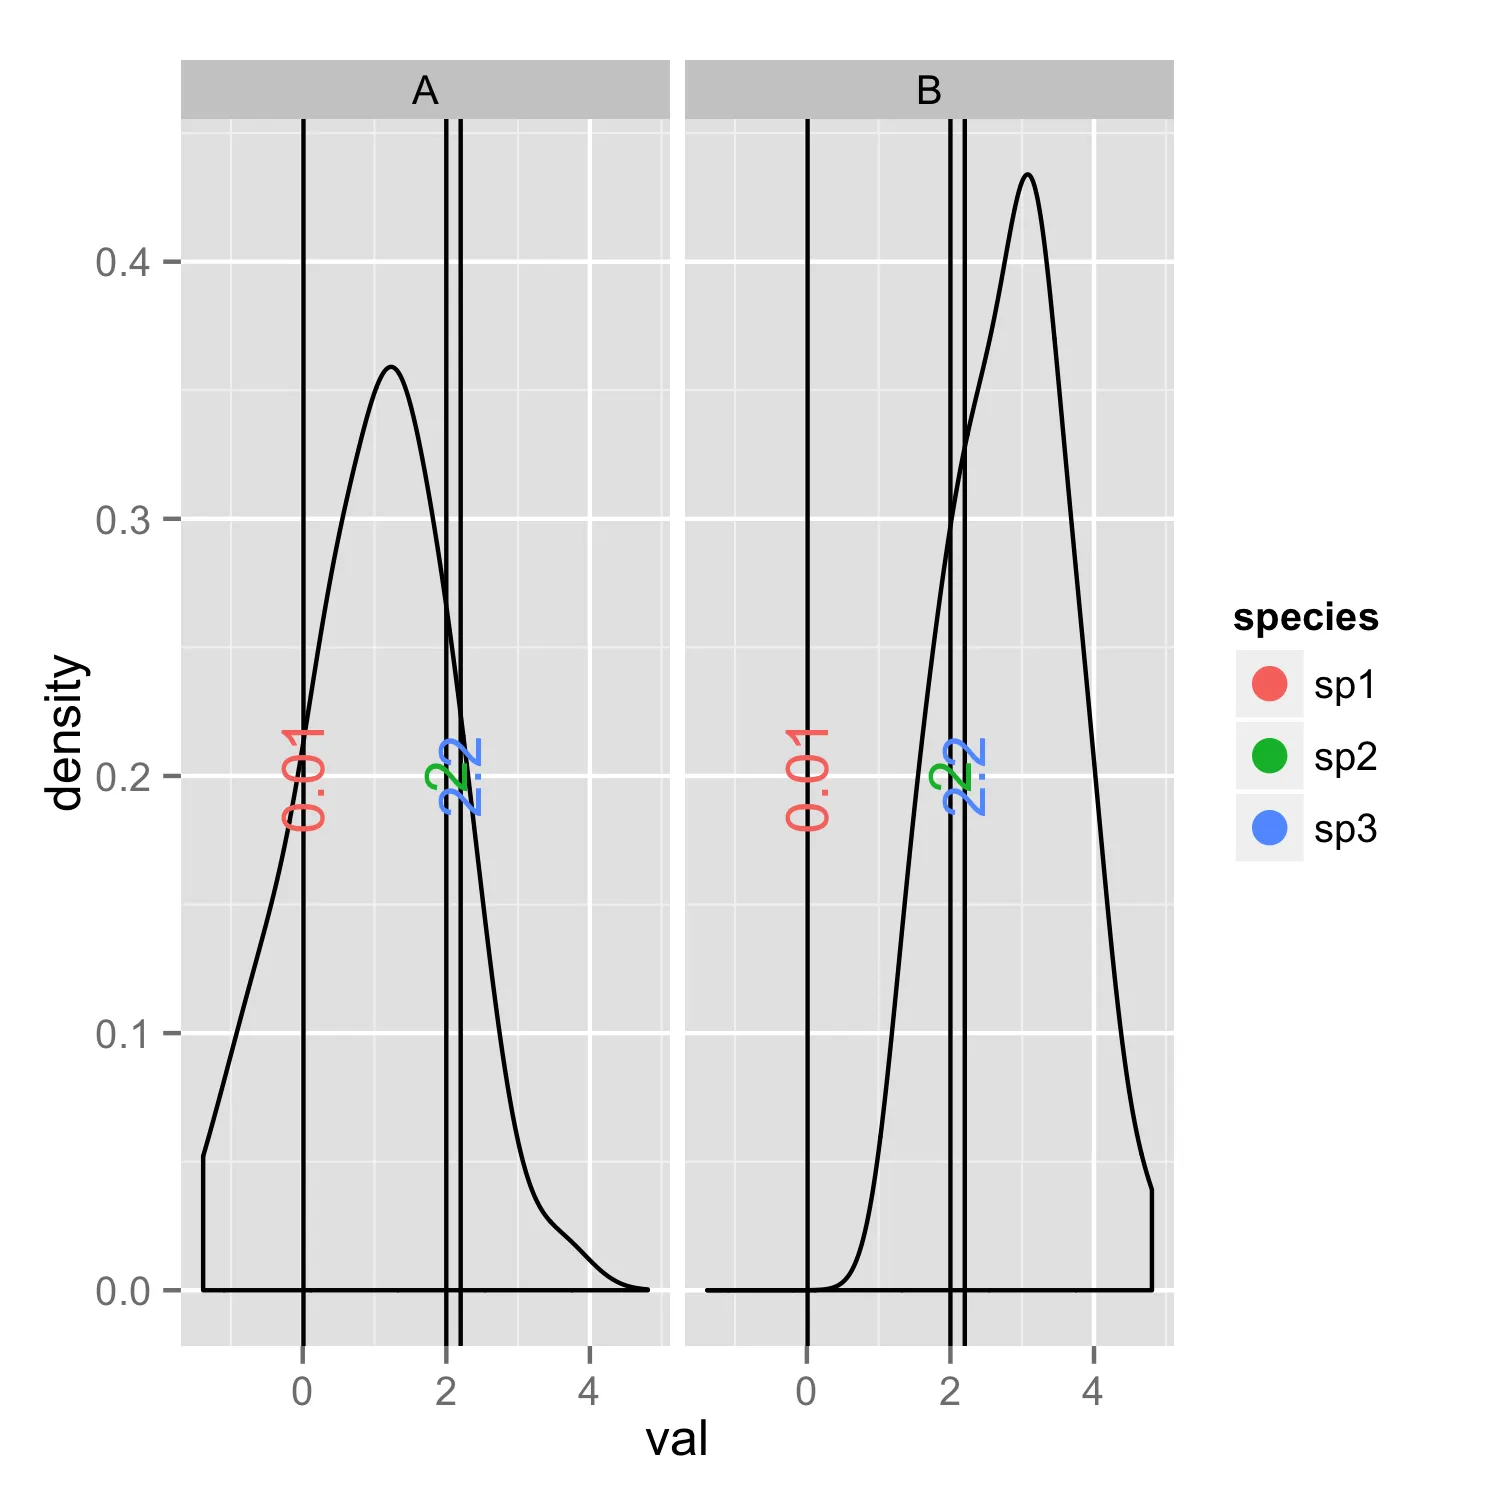
指定指南参数的另一种替代方法是使用guides函数而不是将其作为参数传递给scale_colour_manual:
ggplot(majdf, aes(x = val)) +
  geom_point(data = majtxt, aes(x = geq, colour = species),
             y = 0.2, size = 0) +
  geom_density() +
  geom_vline(data = majtxt, aes(xintercept = geq)) +
  geom_text(data = majtxt, aes(x = geq, y = 0.2, label = geq, color = species),
            angle = 90, show_guide = FALSE) +
  facet_wrap(~ lvl) +
  guides(colour = guide_legend(override.aes=list(size=4)))
生成的图形是相同的。