我曾使用dplyr进行我的数据处理,但有些计算速度较慢。特别是通过组进行子集操作时,据我所知,当分组数很多时,dplyr 的运算速度较慢。根据这个基准测试,data.table可能更快,因此我开始学习 data.table。
以下是如何使用250k行和约230k个组的真实数据的近似重现方法:我想按id1、id2进行分组,并对每个组中max(datetime)的行进行子集操作。
数据
# random datetime generation function by Dirk Eddelbuettel
# https://dev59.com/62Uq5IYBdhLWcg3wMNYK
rand.datetime <- function(N, st = "2012/01/01", et = "2015/08/05") {
  st <- as.POSIXct(as.Date(st))
  et <- as.POSIXct(as.Date(et))
  dt <- as.numeric(difftime(et,st,unit="sec"))
  ev <- sort(runif(N, 0, dt))
  rt <- st + ev
}

set.seed(42)
# Creating 230000 ids couples
ids <- data.frame(id1 = stringi::stri_rand_strings(23e4, 9, pattern = "[0-9]"),
                  id2 = stringi::stri_rand_strings(23e4, 9, pattern = "[0-9]"))
# Repeating randomly the ids[1:2000, ] to create groups
ids <- rbind(ids, ids[sample(1:2000, 20000, replace = TRUE), ])
# Adding random datetime variable and dummy variables to reproduce real datas
datas <- transform(ids,
                   datetime = rand.datetime(25e4),
                   var1 = sample(LETTERS[1:6], 25e4, rep = TRUE),
                   var2 = sample(c(1:10, NA), 25e4, rep = TRUE),
                   var3 = sample(c(1:10, NA), 25e4, rep = TRUE),
                   var4 = rand.datetime(25e4),
                   var5 = rand.datetime(25e4))

datas.tbl <- tbl_df(datas)
datas.dt <- data.table(datas, key = c("id1", "id2"))
我在使用data.table时找不到直接按组进行子集操作的方法,因此我提出了这个问题:Filter rows by groups with data.table
他们建议我使用.SD:
datas.dt[, .SD[datetime == max(datetime)], by = c("id1", "id2")]
但是我有两个问题,它可以处理日期但不能处理POSIXct ("Error in UseMethod("as.data.table") : no applicable method for 'as.data.table' applied to an object of class "c('POSIXct', 'POSIXt')""), 而且这很慢。例如,对于日期:
> system.time({
+   datas.dt[, .SD[as.Date(datetime) == max(as.Date(datetime))], by = c("id1", "id2")]
+ })
 utilisateur     système      écoulé
      207.03        0.00      207.48
所以我找到了使用data.table更快地实现此操作的其他方法,并保留了日期时间:
函数
f.dplyr <- function(x) x %>% group_by(id1, id2) %>% filter(datetime == max(datetime))
f.dt.i <- function(x) x[x[, .I[datetime == max(datetime)], by = c("id1", "id2")]$V1]
f.dt <- function(x) x[x[, datetime == max(datetime), by = c("id1", "id2")]$V1]
但是我认为data.table会更快,与dplyr相比的时间差异不显著。
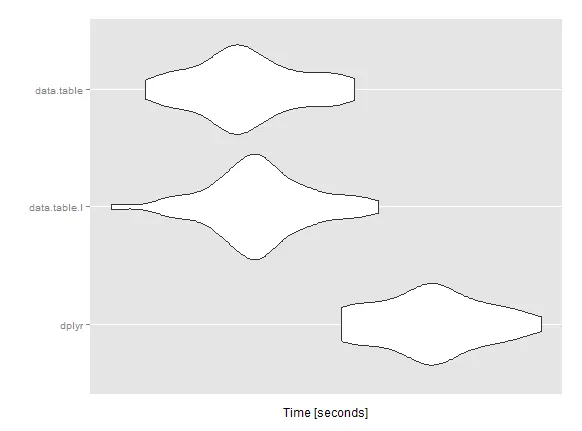
微基准测试
mbm <- microbenchmark(
  dplyr = res1 <- f.dplyr(datas.tbl),
  data.table.I = res2 <- f.dt.i(datas.dt),
  data.table = res3 <- f.dt(datas.dt),
  times = 50L)

Unit: seconds
         expr      min       lq     mean   median       uq      max neval
        dplyr 31.84249 32.24055 32.59046 32.61311 32.88703 33.54226    50
 data.table.I 30.02831 30.94621 31.19660 31.17820 31.42888 32.16521    50
   data.table 30.28923 30.84212 31.09749 31.04851 31.40432 31.96351    50
我在使用 data.table 时错过/误用了什么吗?你有什么想法可以加速这个计算吗?
非常感谢您的任何帮助!谢谢
编辑:关于微基准测试所使用的系统和软件包版本的一些详细说明。(电脑不是战争机器,12Go i5)
系统
sessionInfo()
R version 3.1.3 (2015-03-09)
Platform: x86_64-w64-mingw32/x64 (64-bit)
Running under: Windows 7 x64 (build 7601) Service Pack 1

locale:
  [1] LC_COLLATE=French_France.1252  LC_CTYPE=French_France.1252
[3] LC_MONETARY=French_France.1252 LC_NUMERIC=C
[5] LC_TIME=French_France.1252

attached base packages:
  [1] stats     graphics  grDevices utils     datasets  methods   base

other attached packages:
  [1] readr_0.1.0          ggplot2_1.0.1        microbenchmark_1.4-2
[4] data.table_1.9.4     dplyr_0.4.1          plyr_1.8.2

loaded via a namespace (and not attached):
  [1] assertthat_0.1   chron_2.3-45     colorspace_1.2-6 DBI_0.3.1
[5] digest_0.6.8     grid_3.1.3       gtable_0.1.2     lazyeval_0.1.10
[9] magrittr_1.5     MASS_7.3-39      munsell_0.4.2    parallel_3.1.3
[13] proto_0.3-10     Rcpp_0.11.5      reshape2_1.4.1   scales_0.2.4
[17] stringi_0.4-1    stringr_0.6.2    tools_3.1.3

> packageVersion("data.table")
[1] ‘1.9.4’
> packageVersion("dplyr")
[1] ‘0.4.1’
which.max返回的第一个值?另外,datas.dt[, .SD[as.Date(datetime) == max(as.Date(datetime))], by = c("id1", "id2")]是一种不好的做法。在子集化之前,你应该将date转换为IDate类型。 - David Arenburgx %>% group_by(id1, id2) %>% slice(which(datetime == max(datetime)))吗? - talatdatas.dt[, datetime := as.IDate(datetime)] ; system.time(datas.dt[datas.dt[, .I[datetime == max(datetime)], by = c("id1", "id2")]$V1])只需要 5 秒钟就能运行完毕,而使用.SD则需要 200 秒钟,因此我很难相信你的基准测试结果。 - David Arenburgdata.table的解决方案,因为他认为它比dplyr更快-这就是为什么我会将你的提议与data.table进行比较,以防他的假设是错误的。 - David Arenburg