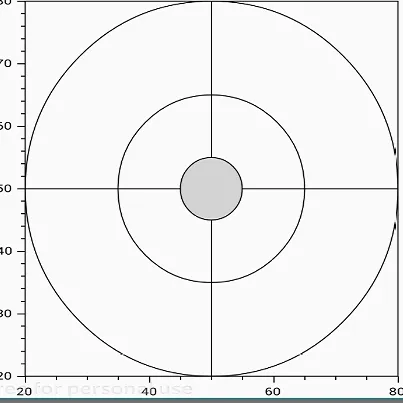
我希望用Oxyplot绘制类似下面的图表,问题是我不知道如何在值为50处绘制带有值的轴。
代码:
        var model = new PlotModel { Title = "EllipseAnnotations" };
        model.Axes.Add( new LinearAxis {
            Position = AxisPosition.Bottom,
            Minimum = 20,
            Maximum = 80,
            PositionAtZeroCrossing = true,
            ExtraGridlines = new[] { 50.0 },
            ExtraGridlineStyle = LineStyle.Dash
        });
        model.Axes.Add(new LinearAxis {
            Position = AxisPosition.Left,
            Minimum = 20,
            Maximum = 80,
            PositionAtZeroCrossing = true,
            ExtraGridlines = new[] { 50.0 }
        });
        model.Annotations.Add(new EllipseAnnotation { X = 50, Y = 50, Width = 10, Height = 10, Fill = OxyColors.LightGray, Stroke = OxyColors.Black, StrokeThickness = 1 });
        model.Annotations.Add(new EllipseAnnotation { X = 50, Y = 50, Width = 30, Height = 30, Fill = OxyColors.Transparent, Stroke = OxyColors.Black, StrokeThickness = 1 });
        model.Annotations.Add(new EllipseAnnotation { X = 50, Y = 50, Width = 60, Height = 60, Fill = OxyColors.Transparent, Stroke = OxyColors.Black, StrokeThickness = 1 });

        //model.Annotations.Add(new EllipseAnnotation { X = 50, Y = 50, Width = 20, Height = 20, Fill = OxyColors.Aqua, Stroke = OxyColors.Black, StrokeThickness = 2 });
        //model.Annotations.Add(new EllipseAnnotation { X = 30, Y = 20, Width = 20, Height = 20, Fill = OxyColors.Red, Stroke = OxyColors.Black, StrokeThickness = 2 });
        //model.Annotations.Add(new EllipseAnnotation { X = 25, Y = 30, Width = 20, Height = 20, Fill = OxyColors.Blue, Stroke = OxyColors.Black, StrokeThickness = 2 });
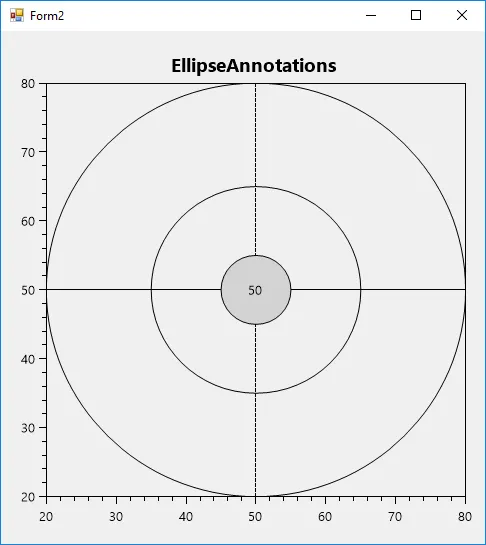
这就是它的样子