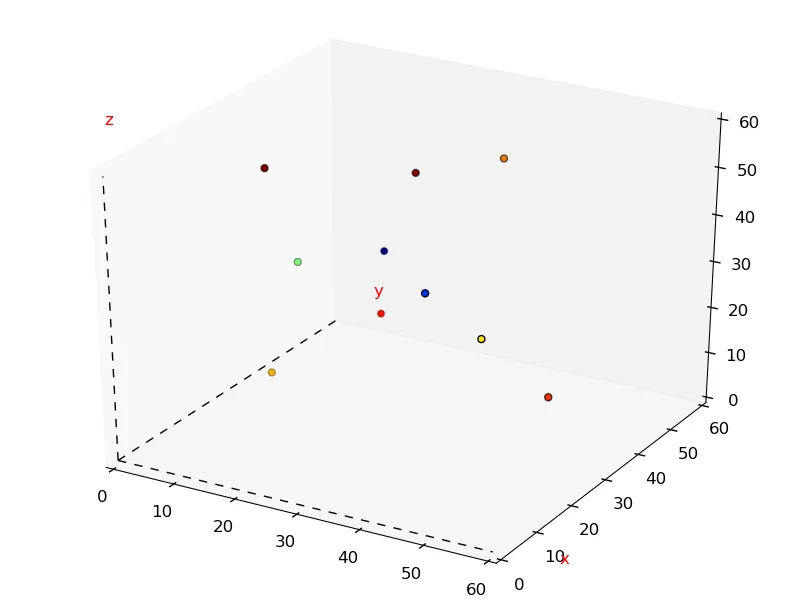
如何在Axes3D类中删除坐标轴?

8

我正在这样使用mplot3d:

fig = plt.figure(figsize=(14,10))

ax = Axes3D(fig,azim=azimuth,elev=elevation)

ax.grid(on=False)

# Additional axes

xspan = np.linspace(0,80+20)
yspan = np.linspace(0,60+20)
zspan = np.linspace(0,60+20)

ax.plot3D(xspan,np.zeros(xspan.shape[0]),np.zeros(xspan.shape[0]),'k--')
ax.plot3D(np.zeros(yspan.shape[0]),yspan,np.zeros(yspan.shape[0]),'k--')
ax.plot3D(np.zeros(zspan.shape[0]),np.zeros(zspan.shape[0]),zspan,'k--')

ax.text(xspan[-1]+10, .5, .5, "x", color='red')
ax.text(.5, yspan[-1]+10, .5, "y", color='red')
ax.text(.5, .5, zspan[-1]+10, "z", color='red')

NZindices = np.nonzero(t2)[0]
#print "Nonzero values of T^2", len(NZindices), "out of", X.shape[0]

ONZ_X, ONZ_Y, ONZ_Z, ONZ_p = [],[],[],[]
INZ_X, INZ_Y, INZ_Z, INZ_p = [],[],[],[]

# Separate indices I/O
for ind in NZindices:
    if ind <= HALF_INDICES:
        INZ_X.append( X[ind] )
        INZ_Y.append( Y[ind] )
        INZ_Z.append( Z[ind] )
        INZ_p.append( t2[ind] )
    else:
        ONZ_X.append( X[ind] )
        ONZ_Y.append( Y[ind] )
        ONZ_Z.append( Z[ind] )
        ONZ_p.append( t2[ind] )

cax = ax.scatter(ONZ_X, ONZ_Y, ONZ_Z, c=ONZ_p, marker='o', s=20 )
cax = ax.scatter(INZ_X, INZ_Y, INZ_Z, c=INZ_p, marker='<', s=20 )

fig.colorbar( cax, shrink=0.7 )

success = float(len(NZindices))/X.shape[0]*100

fig.savefig(fname)
#plt.show()

plt.clf()
plt.close()

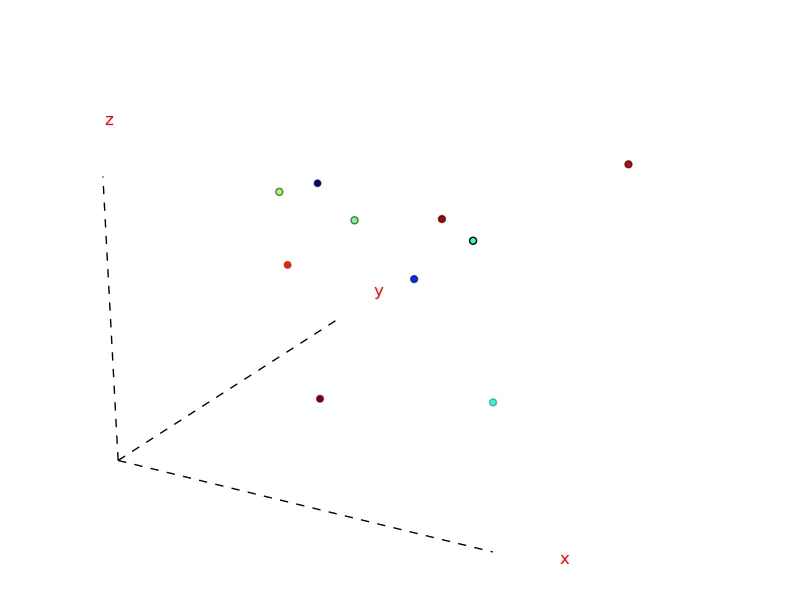
我希望能够在Axes3D中删除默认的(x,y,z)轴。有什么想法吗?谢谢!

顺便提一下,请在以后发布独立的示例代码...这将使您的问题更加容易理解! - Joe Kington
1个回答

10

如果我正确理解了你的问题,你只需要调用ax.axis("off")或等价地调用ax.set_axis_off()即可。

为了确保我们理解一致,你的示例代码可能会生成类似于这样的东西(如果可以按照你发布的方式执行...):

alt text

而你想要的是这样一个结果: alt text

以下是生成下面示例所需的代码,供日后参考:

import matplotlib.pyplot as plt
from mpl_toolkits.mplot3d import Axes3D
import numpy as np

fig = plt.figure()
ax = Axes3D(fig)

# Draw x, y, and z axis markers in the same way you were in
# the code snippet in your question...
xspan, yspan, zspan = 3 * [np.linspace(0,60,20)]
zero = np.zeros_like(xspan)

ax.plot3D(xspan, zero, zero,'k--')
ax.plot3D(zero, yspan, zero,'k--')
ax.plot3D(zero, zero, zspan,'k--')

ax.text(xspan.max() + 10, .5, .5, "x", color='red')
ax.text(.5, yspan.max() + 10, .5, "y", color='red')
ax.text(.5, .5, zspan.max() + 10, "z", color='red')

# Generate and plot some random data...
ndata = 10
x = np.random.uniform(xspan.min(), xspan.max(), ndata)
y = np.random.uniform(yspan.min(), yspan.max(), ndata)
z = np.random.uniform(zspan.min(), zspan.max(), ndata)
c = np.random.random(ndata)

ax.scatter(x, y, z, c=c, marker='o', s=20)

# This line is the only difference between the two plots above!
ax.axis("off")

plt.show()

在matplotlib 1.0.1中,这对我不起作用。现在是否有不同的方法来做这件事,还是这是一个错误? - ptomato
@ptomato - 呃...可能是个bug,但我不确定。不过我也不知道其他解决方法。 - Joe Kington

网页内容由stack overflow 提供, 点击上面的
可以查看英文原文,
原文链接