我正在使用d3.js制作图表。
是否可以像这张图片上那样在甜甜圈图表中添加径向渐变效果?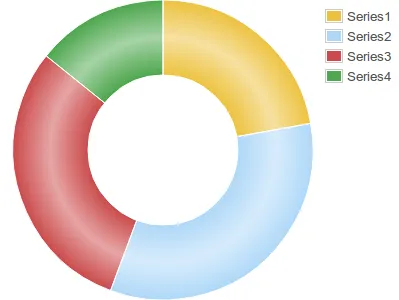
SVG向甜甜圈图表添加径向渐变
5
- Ifozest
1
1个回答
6
假设弧形部分是填充的路径元素,您可以使用径向渐变来获得该结果。请参见此类似问题,我们可以重用示例以获得:
var dataset = {
  apples: [53245, 28479, 19697, 24037, 40245],
};

var width = 460,
    height = 300,
    radius = Math.min(width, height) / 2;

var color = d3.scale.category20();

var pie = d3.layout.pie()
    .sort(null);

var arc = d3.svg.arc()
    .innerRadius(radius - 100)
    .outerRadius(radius - 50);

var svg = d3.select("body").append("svg")
    .attr("width", width)
    .attr("height", height)
    .append("g")
    .attr("transform", "translate(" + width / 2 + "," + height / 2 + ")");

var grads = svg.append("defs").selectAll("radialGradient").data(pie(dataset.apples))
    .enter().append("radialGradient")
    .attr("gradientUnits", "userSpaceOnUse")
    .attr("cx", 0)
    .attr("cy", 0)
    .attr("r", "100%")
    .attr("id", function(d, i) { return "grad" + i; });
grads.append("stop").attr("offset", "15%").style("stop-color", function(d, i) { return color(i); });
grads.append("stop").attr("offset", "20%").style("stop-color", "white");
grads.append("stop").attr("offset", "27%").style("stop-color", function(d, i) { return color(i); });

var path = svg.selectAll("path")
    .data(pie(dataset.apples))
  .enter().append("path")
    .attr("fill", function(d, i) { return "url(#grad" + i + ")"; })
    .attr("d", arc);
Jsfiddle: {{链接1:http://jsfiddle.net/X8hfm/}}
- Erik Dahlström
1
不错的解决方案,我昨天也在干净的SVG上做了类似的事情http://jsfiddle.net/Gf3w8/5/ - Ifozest
网页内容由stack overflow 提供, 点击上面的可以查看英文原文,
原文链接
原文链接
链接可能会对你有所帮助。 - Unknown User