正如John所说,kable(和kableExtra)包可以帮助格式化表格,当你有分组时,还有很多其他的好功能。但是,按要求格式获得输出需要进行一些重塑。
我将使用 MASS 包中的 survey 数据集。
data(survey, package="MASS")
str(survey) # showing only a subset of vars.
'data.frame':   237 obs. of  12 variables:
 $ Sex   : Factor w/ 2 levels "Female","Male": 1 2 2 2 2 1 2 1 2 2 ...
 $ Fold  : Factor w/ 3 levels "L on R","Neither",..: 3 3 1 3 2 1 1 3 3 3 ...
 $ Age   : num  18.2 17.6 16.9 20.3 23.7 ...
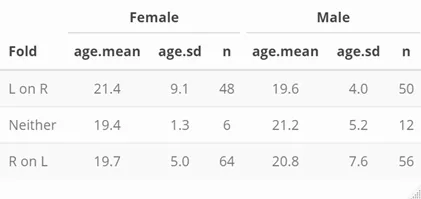
The goal is to get a table similar to this:
library(tidyverse)
library(knitr)
library(kableExtra)
用
gather/
spread 重新塑造数据,并将其保存以便稍后通过 kable 进行呈现。
tbl <- survey %>%
select(Sex, Age, Fold) %>%
filter_all(all_vars(!is.na(.))) %>%
group_by(Fold, Sex) %>%
summarise(n = n(),
age.mean = sprintf("%.1f", mean(Age, na.rm=TRUE)),
age.sd = sprintf("%.1f", sd(Age, na.rm=TRUE))) %>%
gather(key, value, n:age.sd) %>%
unite(Group, Sex, key) %>%
spread(Group, value)
这将返回:
Fold Female_age.mean Female_age.sd Female_n Male_age.mean Male_age.sd Male_n
<fct> <chr> <chr> <chr> <chr> <chr> <chr>
1 L on R 21.4 9.1 48 19.6 4.0 50
2 Neither 19.4 1.3 6 21.2 5.2 12
3 R on L 19.7 5.0 64 20.8 7.6 56
请注意,女性变量出现在男性变量之前。如果我使用以下代码:
pivot_wider(names_from=Sex, values_from=c(n, age.mean, age.sd))
我将得到:
# A tibble: 3 x 7
# Groups:   Fold [3]
  Fold    n_Female n_Male age.mean_Female age.mean_Male age.sd_Female age.sd_Male
  <fct>      <int>  <int> <chr>           <chr>         <chr>         <chr>
1 L on R        48     50 21.4            19.6          9.1           4.0
2 Neither        6     12 19.4            21.2          1.3           5.2
3 R on L        64     56 19.7            20.8          5.0           7.6
以下序列与我们的目标不符。我可以重新排列,但使用 spread 函数能更加方便。 接下来,重新命名列名。由于 dplyr 中的 rename 函数不允许重复的名称,因此我们将使用基本 R。
tbl <- setNames(tbl, nm=sub(".+_", "", names(tbl)))
然后使用kable来应用格式。
kable(tbl, align=c('l', rep('c', 6))) %>%
  kable_styling("striped") %>%
  add_header_above(c(" " = 1, "Female" = 3, "Male" = 3))