创建密度栅格并按多边形要素提取总和

4

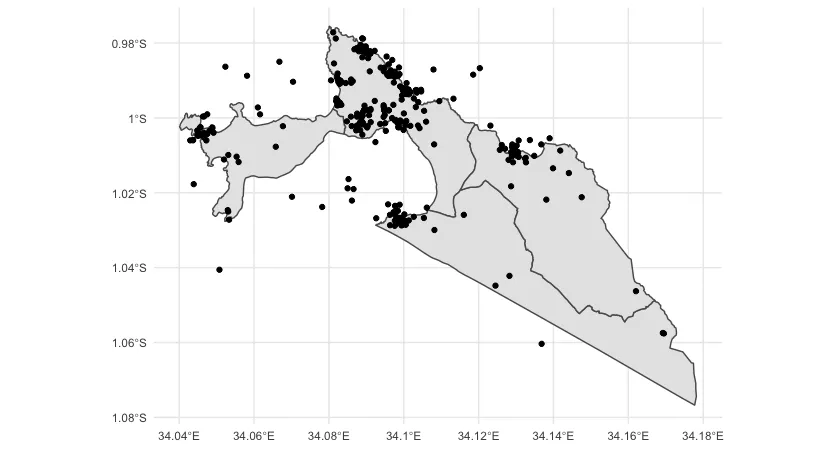
我有一个多边形 (zones) 和一组坐标点 (points)。我想为整个多边形创建一个空间核密度栅格图,并提取每个区域的密度总和。多边形外的点应该被丢弃。

library(raster)
library(tidyverse)
library(sf)
library(spatstat)
library(maptools)

load(url("https://www.dropbox.com/s/iv1s5butsx2v01r/example.RData?dl=1"))
# alternatively, links to gists for each object
# https://gist.github.com/ericpgreen/d80665d22dfa1c05607e75b8d2163b84
# https://gist.github.com/ericpgreen/7f4d3cee3eb5efed5486f7f713306e96

ggplot() +
  geom_sf(data = zones) +
  geom_sf(data = points) +
  theme_minimal()

enter image description here

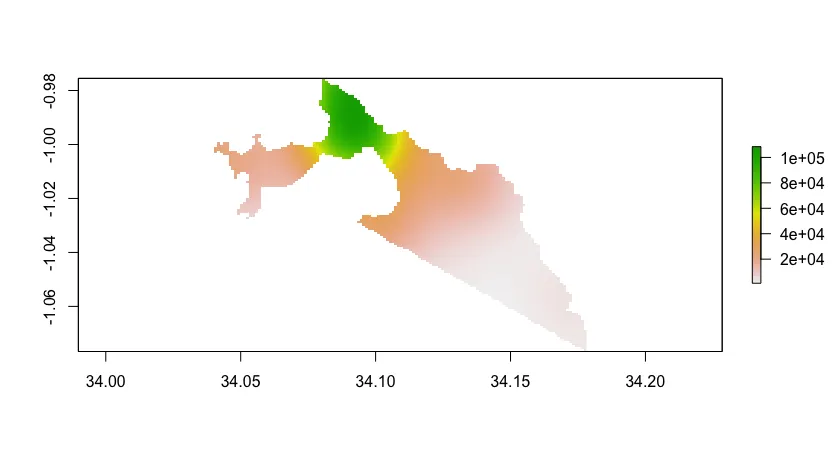
我尝试使用{spatstat}将其转换为ppp,然后使用density()函数,但是结果中的单位让我感到困惑。我认为问题与地图的单位有关,但我不确定该如何继续。

更新

以下是重现我创建的密度图的代码:

zones_owin <- as.owin(as_Spatial(zones))
pts <- st_coordinates(points)
p <- ppp(pts[,1], pts[,2], window=zones_owin, unitname=c("metre","metres"))
ds <- density(p) 
r <- raster(ds)
plot(r)

enter image description here


你能包含所有相关的代码吗?你是如何转换为光栅图的?如果你能在帖子中添加数据样本而不是通过第三方,那就更好了。 - camille
如果用户更喜欢以这种方式获取数据,我已经添加了每个对象的Gist链接。我的光栅码遵循复杂的shapefile转换过程,因此我将示例简化为“sf”对象以在此帖子中重新开始。但是我之前的尝试基本上是 raster(density(ppp())) - Eric Green
@camille 我试着玩了一下,成功复制了我创建的密度图的代码。但是我不确定单位的意义。也许我需要采取完全不同的方法。 - Eric Green
2个回答

1
我不确定这是否回答了你所有的问题,但应该是一个很好的开始。如果你需要不同类型的输出,请在评论或问题中澄清。它会删除所有不在“区域”多边形内的点,按区域计数,并绘制颜色由落在其中的点的数量决定的区域。
library(raster)
library(tidyverse)
library(sf)
#> Linking to GEOS 3.6.2, GDAL 2.2.3, PROJ 4.9.3
library(spatstat)

library(maptools)
#> Checking rgeos availability: TRUE

load(url("https://www.dropbox.com/s/iv1s5butsx2v01r/example.RData?dl=1"))
# alternatively, links to gists for each object
# https://gist.github.com/ericpgreen/d80665d22dfa1c05607e75b8d2163b84
# https://gist.github.com/ericpgreen/7f4d3cee3eb5efed5486f7f713306e96

p1 <- ggplot() +
  geom_sf(data = zones) +
  geom_sf(data = points) +
  theme_minimal()

#Remove points outside of zones
points_inside <- st_intersection(points, zones)
#> although coordinates are longitude/latitude, st_intersection assumes that they are planar
#> Warning: attribute variables are assumed to be spatially constant throughout all
#> geometries
nrow(points)
#> [1] 308
nrow(points_inside)
#> [1] 201

p2 <- ggplot() + 
  geom_sf(data = zones) + 
  geom_sf(data = points_inside)

points_per_zone <- st_join(zones, points_inside) %>%
  count(LocationID.x)
#> although coordinates are longitude/latitude, st_intersects assumes that they are planar

p3 <- ggplot() + 
  geom_sf(data = points_per_zone, 
          aes(fill = n)) + 
  scale_fill_viridis_c(option = 'C')

points_per_zone
#> Simple feature collection with 4 features and 2 fields
#> geometry type:  POLYGON
#> dimension:      XY
#> bbox:           xmin: 34.0401 ymin: -1.076718 xmax: 34.17818 ymax: -0.9755066
#> epsg (SRID):    4326
#> proj4string:    +proj=longlat +ellps=WGS84 +no_defs
#> # A tibble: 4 x 3
#>   LocationID.x     n                                                    geometry
#> *        <dbl> <int>                                               <POLYGON [°]>
#> 1           10   129 ((34.08018 -0.9755066, 34.0803 -0.9757393, 34.08046 -0.975…
#> 2           20    19 ((34.05622 -0.9959458, 34.05642 -0.9960835, 34.05665 -0.99…
#> 3           30    29 ((34.12994 -1.026372, 34.12994 -1.026512, 34.12988 -1.0266…
#> 4           40    24 ((34.11962 -1.001829, 34.11956 -1.002018, 34.11966 -1.0020…

cowplot::plot_grid(p1, p2, p3, nrow = 2, ncol = 2)

似乎我低估了你的问题的难度。下面的图表(和基础数据)是否符合您的要求?

enter image description here

它使用50x50的光栅网格,raster::focal使用9x9的窗口,并使用平均值插值数据。

感谢@mrhellmann。我认为这个很好地计算了每个特征的点数。我正在寻找的是对空间进行一些插值。核密度,IDW等。我尝试过密度,但我很难理解单位的含义。 - Eric Green
我会看看能否提供更接近你所需求的方案。 - mrhellmann
更新后的情节很有趣,非常符合我想象。您能分享如何操作参数吗? - Eric Green
@EricGreen 我会在今晚整理并编辑帖子。 目前生成它的代码是rstudio历史记录中错误步骤的地雷区。 - mrhellmann

1

当您直接使用地理坐标(经度,纬度)时,单位会很困难。如果可能的话,您应该转换为平面坐标(这是spatstat的要求),然后从那里继续。平面坐标通常以米为单位,但我想这取决于特定的投影和基础椭球体等。您可以查看this answer了解如何使用sf将其投影到平面坐标并使用maptools将其导出到spatstat格式。注意:您必须手动选择一个合适的投影(您可以使用http://epsg.io来找到一个),并且必须对多边形和点进行投影。

一旦所有内容都以'spatstat'格式准备好,您可以使用'density.ppp'进行核平滑处理。生成的网格值(类对象'im')是点的密度,即每个单位正方形内的点数(例如每平方米的点数)。如果您想在某个区域进行聚合,可以使用'integral.im(...,domain = ...)'来获取该区域中预期的点数,以便使用给定强度的点过程模型。

非常有帮助!我错过了将数据投影到平面坐标系的st_transform()步骤。你能指导如何改变单位吗?zones现在是+units=m。如果我想把单位设置为公里,该怎么办? - Eric Green
这些单位是特定于投影的。您可以找到使用您要查找的单位的投影,或者在最后进行计算并转换单位(我更喜欢这种方法)。 - Eugene Chong
谢谢。转换比简单的乘法或除法更复杂,对吗? - Eric Green
1
一旦您拥有平面坐标和单位(例如m),将其转换为km只需要简单地除以1000,没有什么花哨的东西。您可以使用rescale函数在spatstat中完成此操作,其中还可以为单位命名,但它并不知道单位本身,因此您不能仅仅要求spatstat将m转换为km。您必须告诉它缩放因子是1000,新名称是km。祝好运! - Ege Rubak

网页内容由stack overflow 提供, 点击上面的
可以查看英文原文,
原文链接