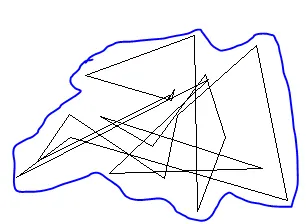
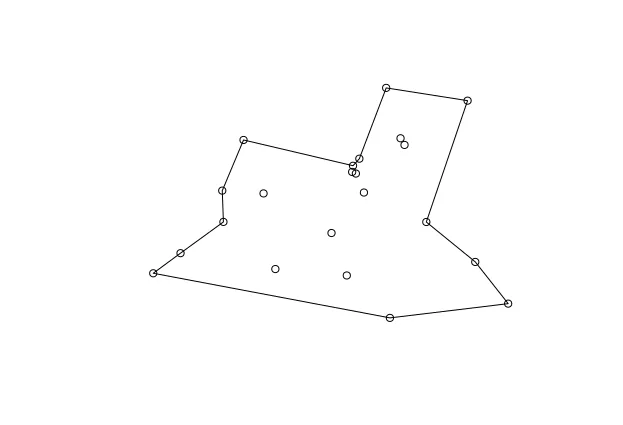
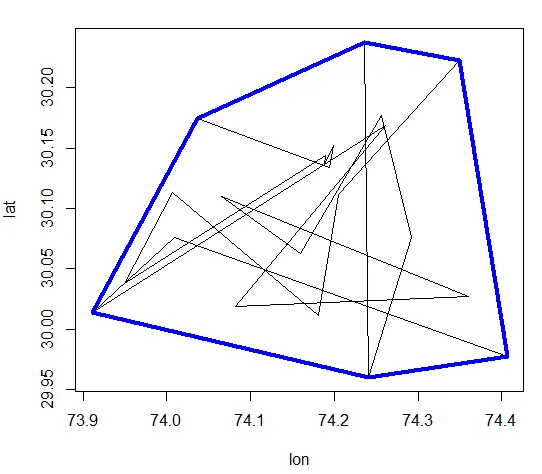
我正在尝试从点集群创建多边形,其边界将接触所有外部点。如有帮助改进我的代码,将不胜感激。
library(dplyr)
library(sf)
df<- read.table(text ="lon lat
74.03687 30.17482
74.23605 30.23773
74.24127 29.95988
74.29211 30.07575
74.25612 30.17687
74.15972 30.06242
74.06484 30.11025
74.36046 30.02749
74.08133 30.01889
74.26168 30.16881
73.91083 30.01378
74.00881 30.07585
74.40638 29.97712
74.34974 30.22231
74.20501 30.11133
74.18108 30.01113
74.00717 30.11362
73.94891 30.03807
74.18977 30.14367
74.18857 30.13621
74.19862 30.15222
74.19376 30.13425",header= T)
polygon <- df %>%
st_as_sf(coords = c("lon", "lat"), crs = 4326) %>%
summarise(geometry = st_combine(geometry)) %>%
st_cast("POLYGON")
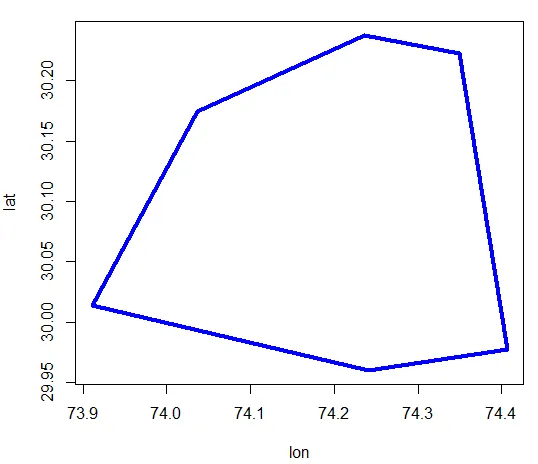
plot(polygon)
需要在单个多边形中输出类似于蓝线的结果。