我开始学习微分方程,并想绘制一些图形。
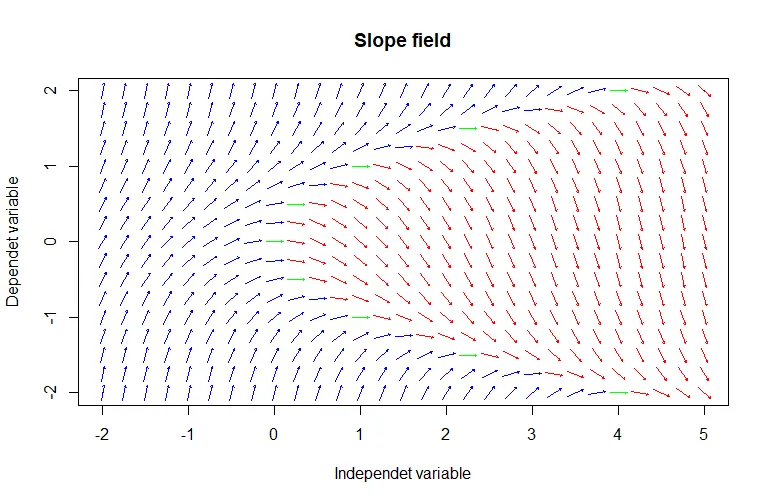
假设我有 dy/dx = -x / y,如何得到如下斜率场:
但如何绘制它?
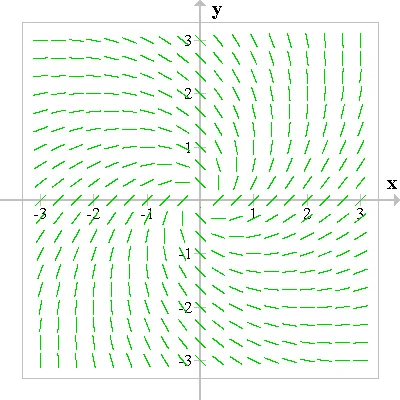
假设我有 dy/dx = -x / y,如何得到如下斜率场:
library(dplyr)

# creating data manually
x <- c(0, 1, 1, -1, 1)
y <- c(1, 1, 0, -1, -1)
slope <- c(0, -1, NaN, -1, 1)

# putting data in dataframe
data <- data_frame(x, y, slope)
但如何绘制它?