我希望能在两个经纬度点之间绘制一条曲线(贝塞尔曲线)。目前我正在参考this post(该代码使用JavaScript编写)。
使用三次贝塞尔方程获取曲线点的代码
以下是展示我尝试的不同测试用例的图片。
案例1:P1-孟买,P2-钦奈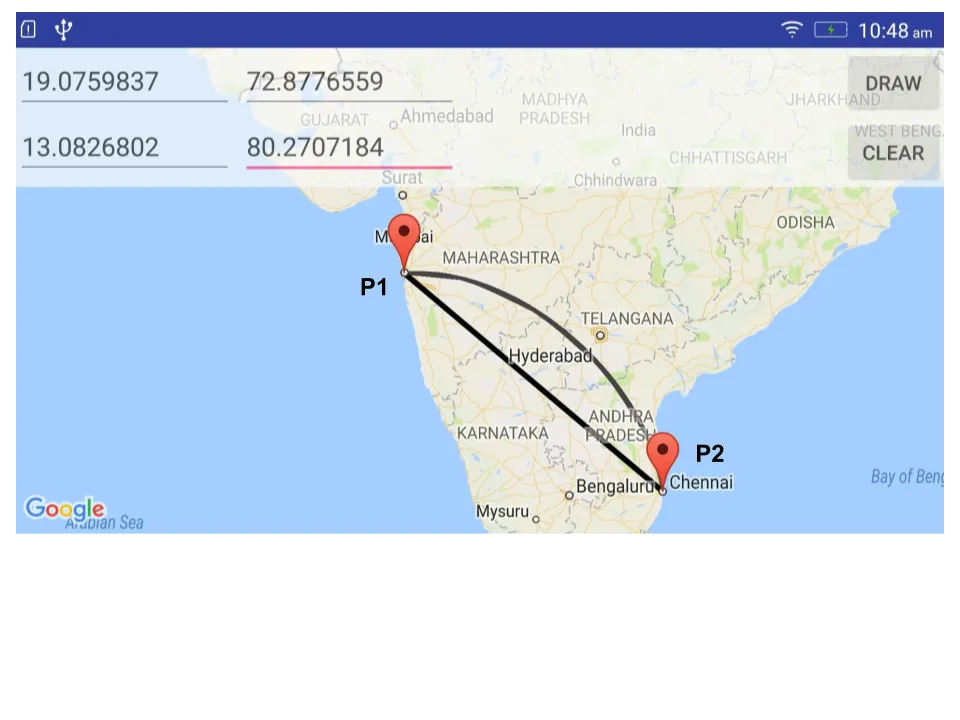 案例2:P1-法国,P2-新加坡
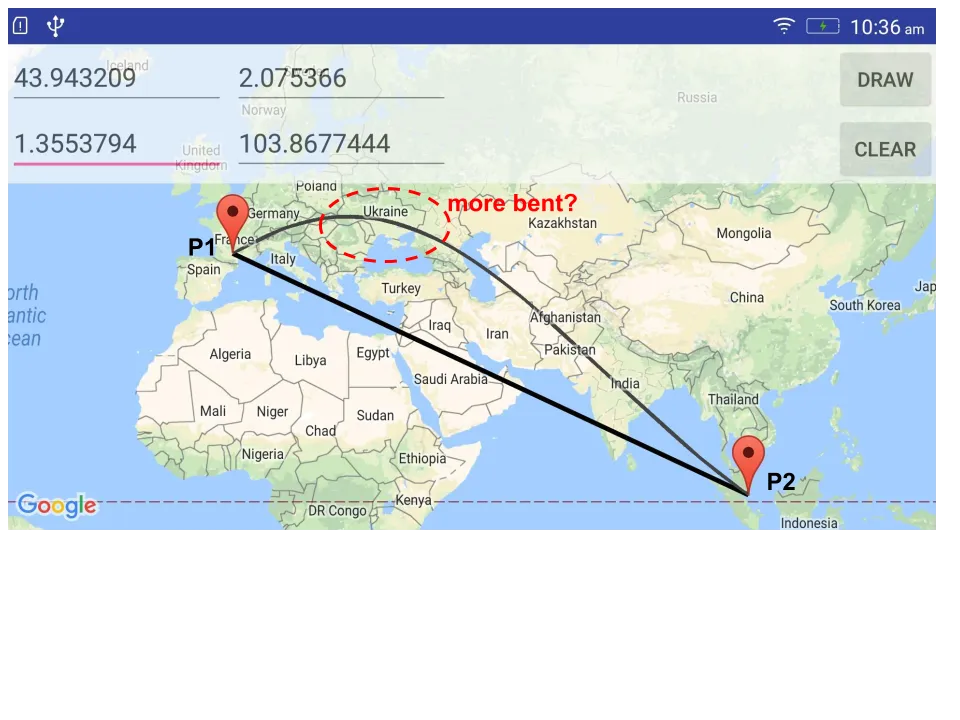
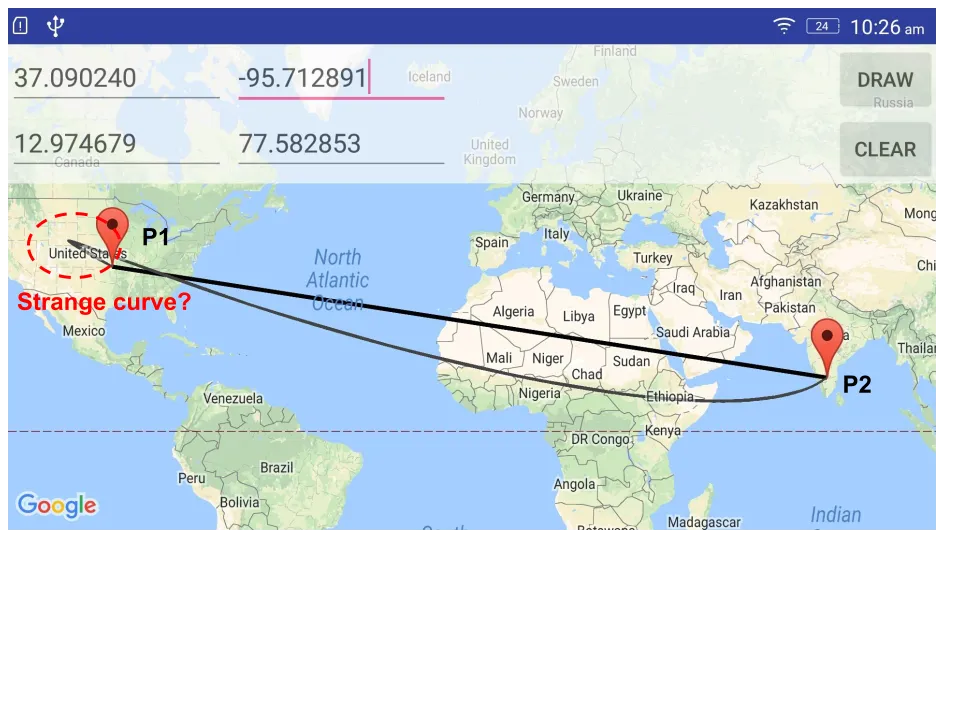
 案例3:P1-美国,P2-班加罗尔
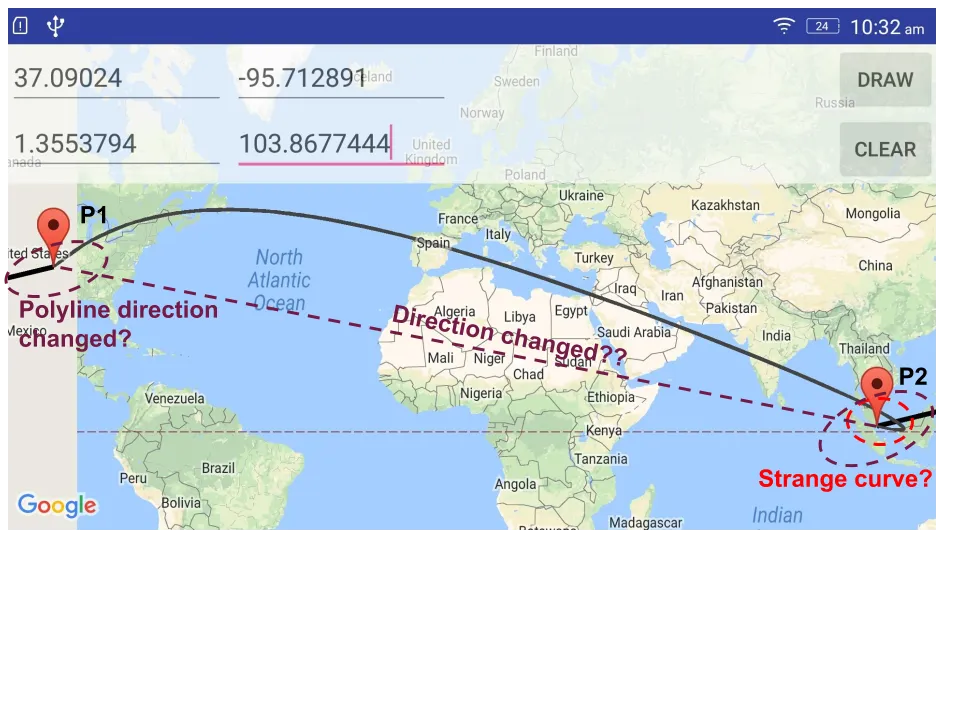
 案例4:P1-美国,P2-新加坡
 问题:
问题:
private void drawElementsOnMap(LatLng init, LatLng end) {

    mMap.addMarker(new MarkerOptions().position(init));
    mMap.addMarker(new MarkerOptions().position(end));

    LatLngBounds.Builder bc = new LatLngBounds.Builder();
    bc.include(init);
    bc.include(end);

    mMap.moveCamera(CameraUpdateFactory.newLatLngBounds(bc.build(), 100));

    PolylineOptions line = new PolylineOptions();
    line.add(init);
    line.add(end);
    mMap.addPolyline(line);

    double distanceBetween = SphericalUtil.computeDistanceBetween(init, end);
    double lineHeadingInit = SphericalUtil.computeHeading(init, end);
    double lineHeadingEnd = bearing(end, init);*/

    double lineHeading1, lineHeading2;
    if (lineHeadingInit < 0) {
        lineHeading1 = lineHeadingInit + 45;
        lineHeading2 = lineHeadingInit + 135;
    } else {
        lineHeading1 = lineHeadingInit + -45;
        lineHeading2 = lineHeadingInit + -135;
    }

    LatLng pA = SphericalUtil.computeOffset(init, distanceBetween / 2.5, lineHeading1);
    LatLng pB = SphericalUtil.computeOffset(end, distanceBetween / 2.5, lineHeading2);

    // Beizer curves with 4 points
    gmapsCubicBezier(init, end, pA, pB);
}

private void gmapsCubicBezier(LatLng p1, LatLng p2, LatLng pA, LatLng pB) {

    //Polyline options
    PolylineOptions options = new PolylineOptions();

    LatLng curveLatLng = null;
    for (double t = 0.0; t < 1.01; t += 0.01) {
        // P = (1−t)3P1 + 3(1−t)2tP2 +3(1−t)t2P3 + t3P4; for 4 points
        double arcX = (1 - t) * (1 - t) * (1 - t) * p1.latitude
                + 3 * (1 - t) * (1 - t) * t * pA.latitude
                + 3 * (1 - t) * t * t * pB.latitude
                + t * t * t * p2.latitude;
        double arcY = (1 - t) * (1 - t) * (1 - t) * p1.longitude
                + 3 * (1 - t) * (1 - t) * t * pA.longitude
                + 3 * (1 - t) * t * t * pB.longitude
                + t * t * t * p2.longitude;

        curveLatLng = new LatLng(arcX, arcY);
        options.add(curveLatLng);
        //Draw polyline
        mMap.addPolyline(options.width(5).color(Color.DKGRAY).geodesic(false));
    }
    mMap.addMarker(new MarkerOptions().position(curveLatLng));
}
以下是展示我尝试的不同测试用例的图片。
案例1:P1-孟买,P2-钦奈
案例2:P1-法国,P2-新加坡
案例3:P1-美国,P2-班加罗尔
案例4:P1-美国,P2-新加坡
问题:
1) 为什么算法只能在情况1下绘制出相当不错的曲线?
2) 为什么贝塞尔曲线在情况2下会向一侧弯曲?
3) 为什么贝塞尔曲线在情况3和4中看起来不同(P1处有奇怪的尖点(情况3)和P2处有尖点(情况4))。有没有办法避免这种情况?
4) 为什么折线在情况4下绘制方式不同(方向?)?
我无法理解曲线绘制的模式。如果我做错了什么,请告诉我。