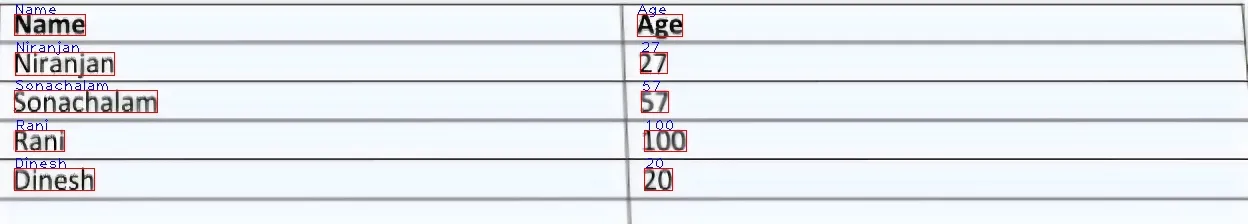
我有一张模糊且含有噪声的图片。我尝试了以下示例中的图像去噪。
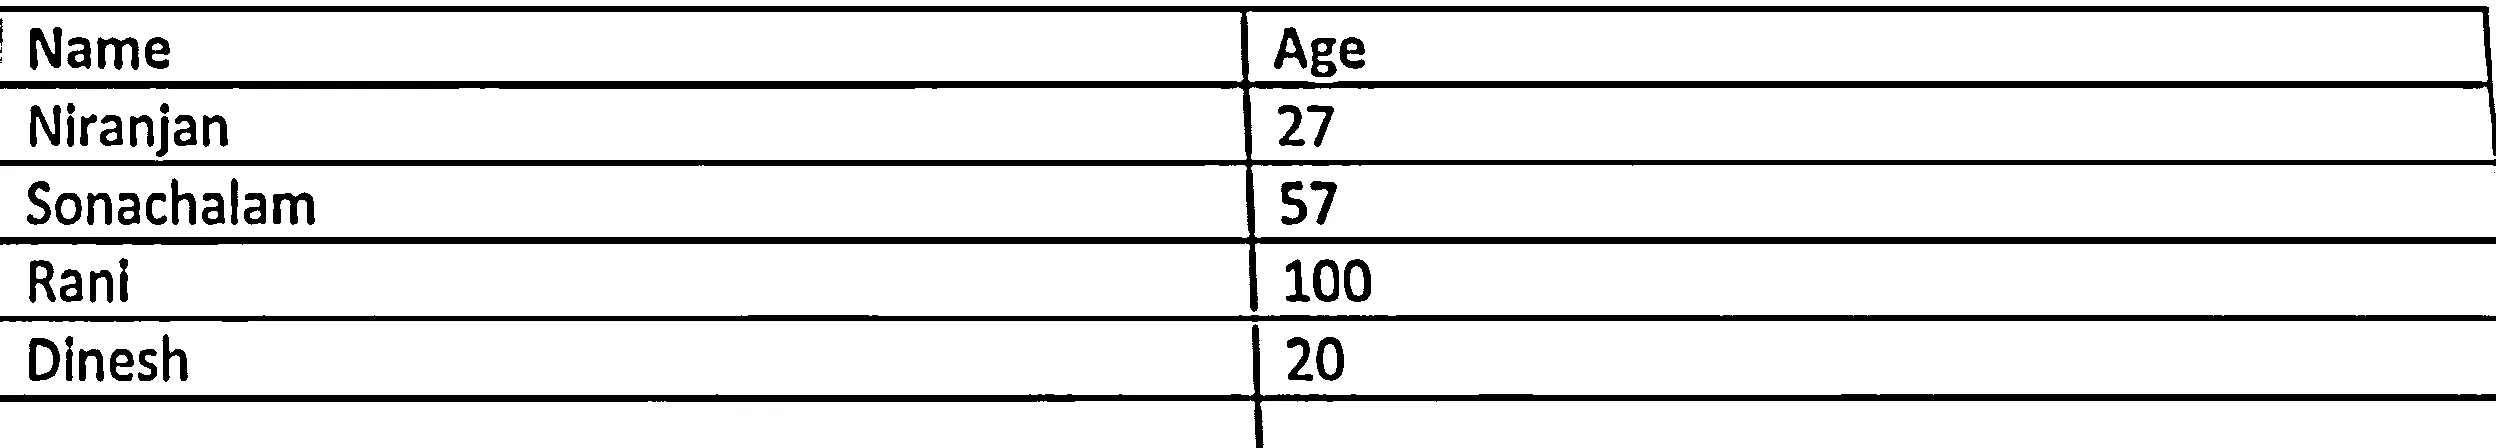
上述代码的输出结果: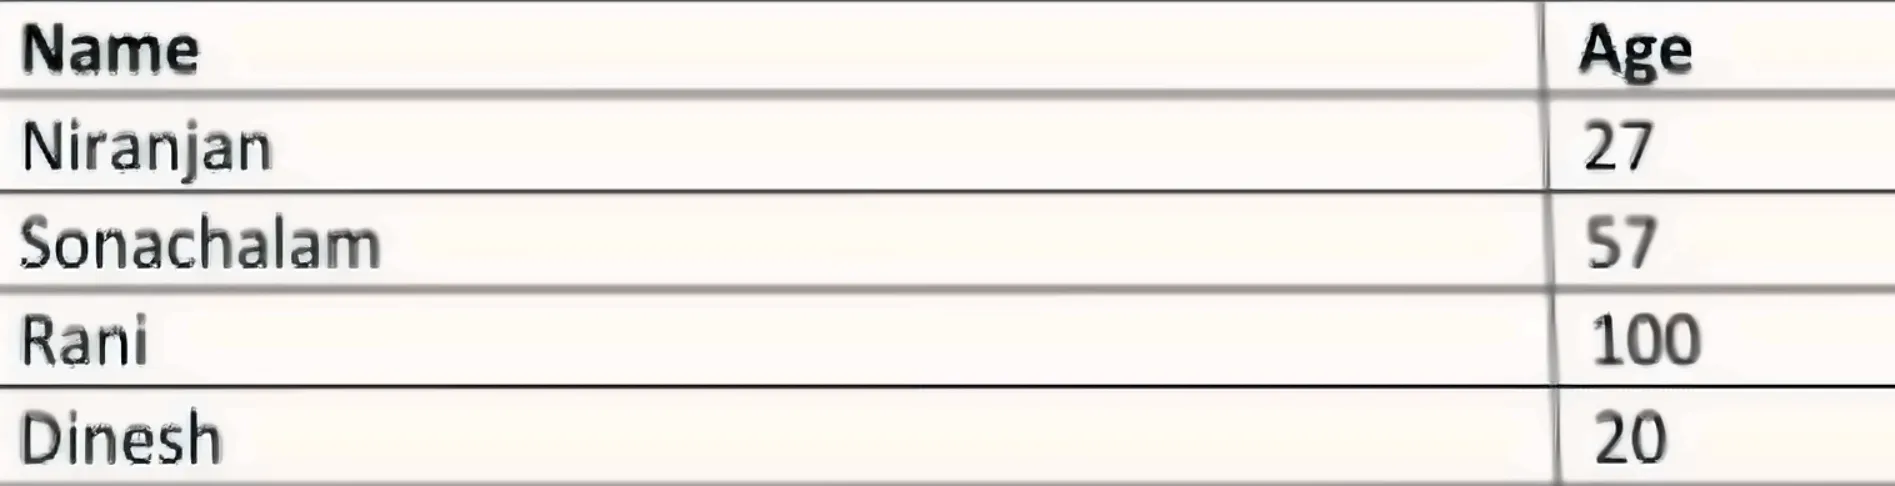 上述代码去除了一些噪点。但是一些数字和表格线条变得模糊了。
有没有人可以建议一个更好的解决方案来消除上面图像的模糊和噪音?
使用非局部均值去噪算法从彩色图像中去除高斯噪声的代码:
import numpy as np
import cv2
from matplotlib import pyplot as plt

img = cv2.imread("data_5/1.png")
b,g,r = cv2.split(img)           # get b,g,r
rgb_img = cv2.merge([r,g,b])     # switch it to rgb

# Denoising

dst = cv2.fastNlMeansDenoisingColored(img,None,10,10,7,21)
b,g,r = cv2.split(dst)           # get b,g,r
rgb_dst = cv2.merge([r,g,b])     # switch it to rgb


cv2.imshow('denoising black and white', rgb_dst)
cv2.waitKey(0)
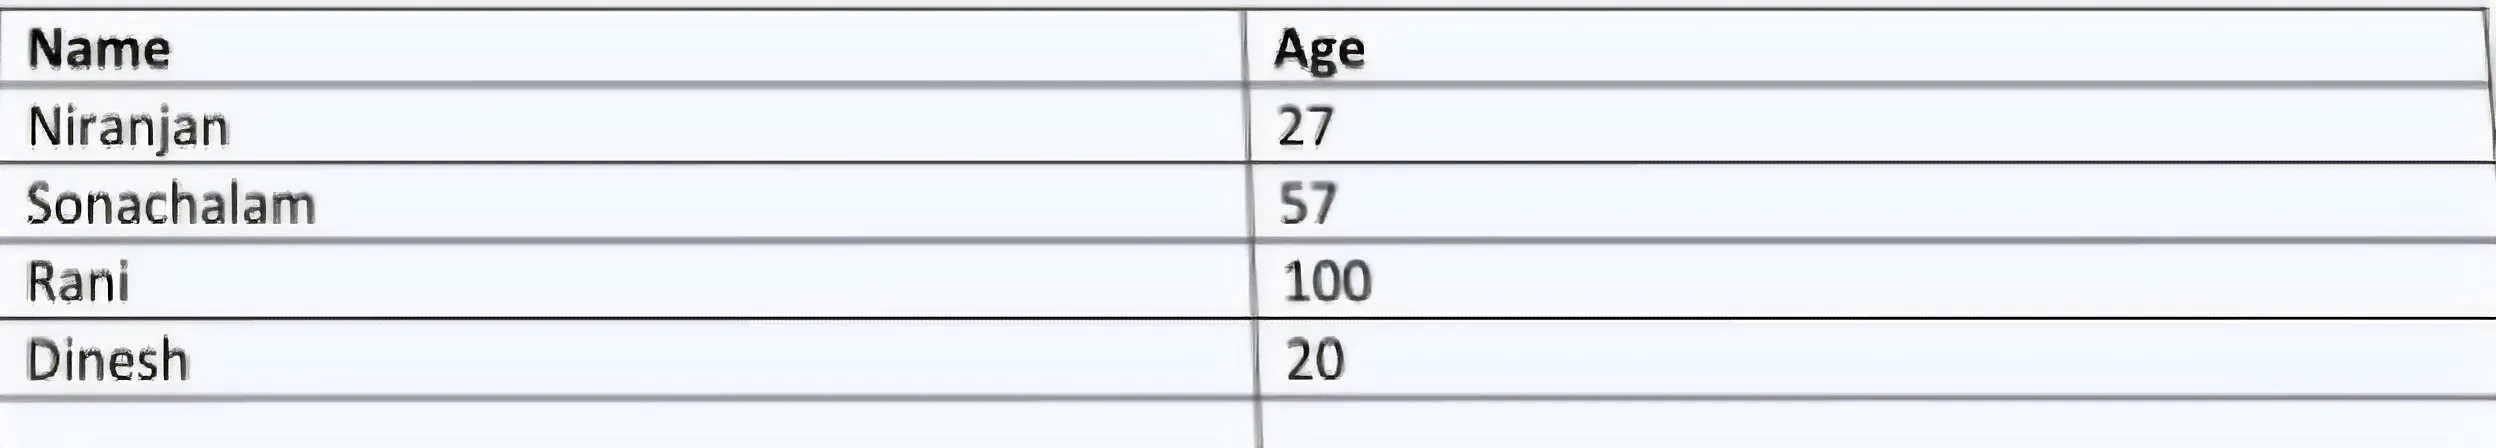
上述代码的输出结果:
上述代码去除了一些噪点。但是一些数字和表格线条变得模糊了。有没有人可以建议一个更好的解决方案来消除上面图像的模糊和噪音?