就像这个问题一样:
我发现hovertool未对多线图实现,这有点令人失望。 这在此处的“警告”下提到:http://docs.bokeh.org/en/0.11.0/docs/reference/models/tools.html#bokeh.models.tools.HoverTool
是否有任何解决方法? 另外,如果我要实现此功能,从哪里开始,有没有什么特别的注意事项? 此功能是否在当前的Bokeh路线图中?
就像这个问题一样:
我发现hovertool未对多线图实现,这有点令人失望。 这在此处的“警告”下提到:http://docs.bokeh.org/en/0.11.0/docs/reference/models/tools.html#bokeh.models.tools.HoverTool
是否有任何解决方法? 另外,如果我要实现此功能,从哪里开始,有没有什么特别的注意事项? 此功能是否在当前的Bokeh路线图中?
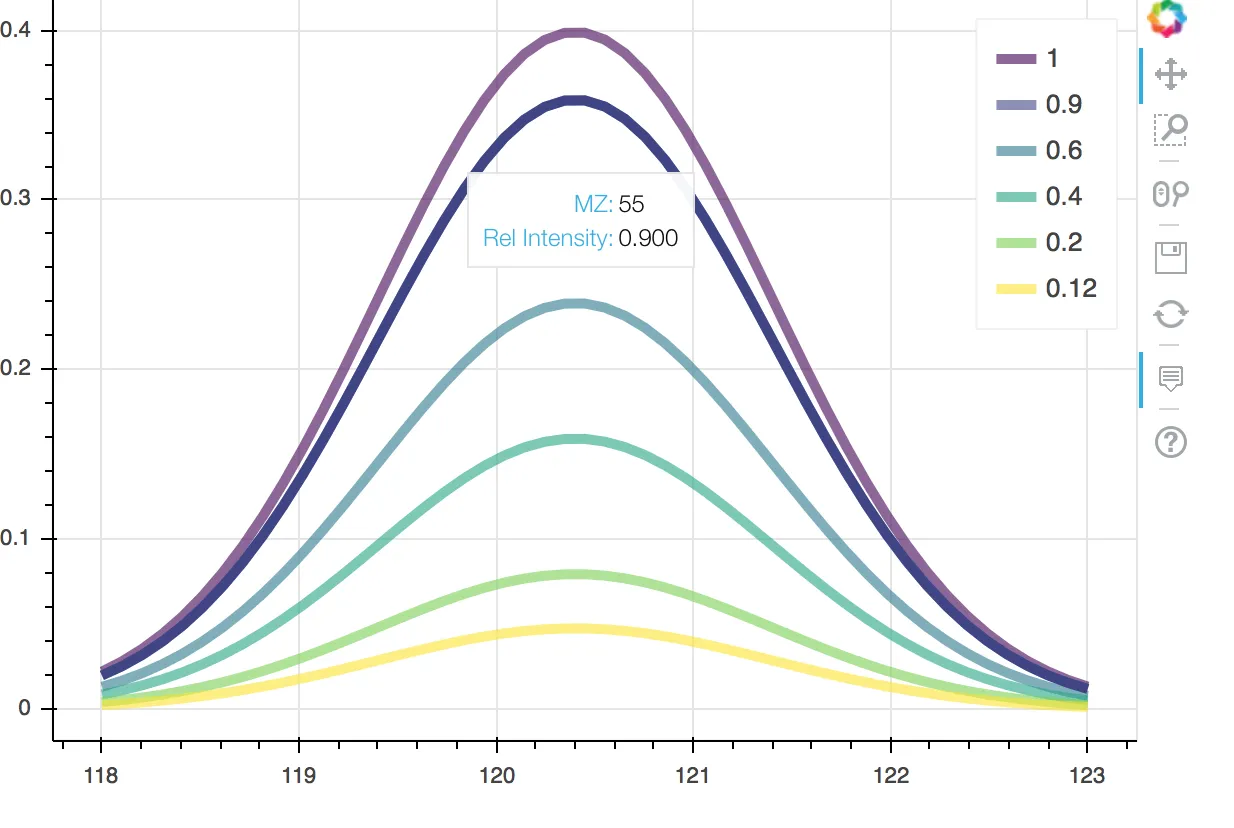
从Bokeh 0.12.4版本开始(实际上更早,但我忘记了确切的发布版本),悬停工具支持mutli_line:
from collections import defaultdict

import numpy as np
from scipy.stats import norm

from bokeh.plotting import show, figure
from bokeh.models import ColumnDataSource, HoverTool
from bokeh.palettes import Viridis6

RT_x = np.linspace(118, 123, num=50)

mass_spec = defaultdict(list)
for scale, mz in [(1.0, 83), (0.9, 55), (0.6, 98), (0.4, 43), (0.2, 39), (0.12, 29)]:
    mass_spec["RT"].append(RT_x)
    mass_spec["RT_intensity"].append(norm(loc=120.4).pdf(RT_x) * scale)
    mass_spec['MZ_tip'].append(mz)
    mass_spec['Intensity_tip'].append(scale)
mass_spec['color'] = Viridis6

source = ColumnDataSource(mass_spec)

p = figure(plot_height=400)
p.multi_line(xs='RT', ys='RT_intensity', legend="Intensity_tip",
             line_width=5, line_color='color', line_alpha=0.6,
             hover_line_color='color', hover_line_alpha=1.0,
             source=source)

p.add_tools(HoverTool(show_arrow=False, line_policy='next', tooltips=[
    ('MZ', '@MZ_tip'),
    ('Rel Intensity', '@Intensity_tip')
]))

show(p)
这会导致
hover_line_alpha关键字,这会在0.12.4中给出AttributeError:对于MultiLine,意外的属性'hover_line_alpha'...。 'bokeh.plotting.figure'比'bokeh.models.Plot'更受欢迎吗(老实说我真的不理解其中的区别)? - jonalmhover_line_alpha 是一个更高级别的便利功能。MultiLine 和 Plot 都是低级别的构建块。例如,Plot 基本上只是一个可以绘制东西的容器。你可以把轴和网格放进去,但是 你 必须自己做。figure 是一个更高级别的 API,它为您组合了一个带有轴和工具的基本图。更多信息:http://bokeh.pydata.org/en/latest/docs/user_guide/concepts.html#interfaces - bigreddot$x和$y。特殊已知字段的完整列表:http://docs.bokeh.org/en/latest/docs/reference/models/tools.html#bokeh.models.tools.HoverTool.tooltips - Matt Popovich