使用Angular SVG或画布来应用渐变颜色

4
我正在使用 Angular 和 D3 创建甜甜圈图表(在指令中)。
我可以很容易地为填充区域设置颜色(在这个 Plunker 中是蓝色),但我想要做的是让 SVG 图表能够平滑地改变颜色:
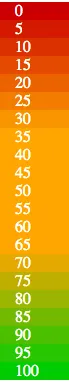
0% - 33.3% - red
33.4% - 66.66% - orange
66.7% - 100% green

指令:

app.directive('donutDirective', function() {
    return {
        restrict: 'E',
        scope: {
            radius: '=',
            percent: '=',
            text: '=',
        },
        link: function(scope, element, attrs) {
            var radius = scope.radius,
                percent = scope.percent,
                percentLabel = scope.text,
                format = d3.format(".0%"),
                progress = 0;

            var svg = d3.select(element[0])
                .append('svg')
                .style('width', radius/2+'px')
                .style('height', radius/2+'px');

            var donutScale = d3.scale.linear()
                .domain([0, 100])
                .range([0, 2 * Math.PI]);

            //var color = "#5599aa";
            var color = "#018BBB";

            var data = [
                [0,100,"#b8b5b8"],
                [0,0,color]
            ];

            var arc = d3.svg.arc()
                .innerRadius(radius/6)
                .outerRadius(radius/4)
                .startAngle(function(d){return donutScale(d[0]);})
                .endAngle(function(d){return donutScale(d[1]);});

            var text = svg.append("text")
                .attr("x",radius/4)
                .attr("y",radius/4)
                .attr("dy", ".35em")
                .attr("text-anchor", "middle")
                .attr("font-size","14px")
                .style("fill","black")
                .attr("text-anchor", "middle")
                .text(percentLabel);

            var path = svg.selectAll("path")
                .data(data)
                .enter()
                .append("path")
                .style("fill", function(d){return d[2];})
                .attr("d", arc)
                .each(function(d) {
                    this._current = d;
                    // console.log(this._current)
                ;});

            // update the data!
            data = [
                [0,100,"#b8b5b8"],
                [0,percent,color]
            ];

            path
                .data(data)
                .attr("transform", "translate("+radius/4+","+radius/4+")")
                .transition(200).duration(2150).ease('linear')
                .attrTween("d", function (a) {
                    var i  = d3.interpolate(this._current, a);
                    var i2 = d3.interpolate(progress, percent)
                    this._current = i(0);
                    // console.log(this._current);
                    return function(t) {
                        text.text( format(i2(t) / 100) );
                        return arc(i(t));
                    };
                });
        }
    };
});

Plunker: http://plnkr.co/edit/8qGMeQkmM08CZxZIVRei?p=preview

2个回答

3

首先,给路径添加ID,如下所示:

var path = svg.selectAll("path")
                .data(data)
                .enter()
                .append("path")
                .style("fill", function(d){return d[2];})
                .attr("d", arc)
                .attr("id", function(d,i){return "id"+i;})//give id

然后在补间传递中通过条件并更改路径的颜色。

.attrTween("d", function (a) {
                    var i  = d3.interpolate(this._current, a);
                    var i2 = d3.interpolate(progress, percent)
                    this._current = i(0);

                    return function(t) {
                        if(i2(t) < 33.3)
                          d3.selectAll("#id1").style("fill", "red")
                        else if(i2(t) < 66.6)
                          d3.selectAll("#id1").style("fill", "orange")
                        else if(i2(t) > 66.6)
                          d3.selectAll("#id1").style("fill", "green")

                        text.text( format(i2(t) / 100) );
                        return arc(i(t));
                    };
                });

这里是关于IT技术的代码示例链接

编辑

在你的指令中,你可以像这样在defs中创建gradient

        var defs = svg.append("defs");
        var gradient1 = defs.append("linearGradient").attr("id", "gradient1");
        gradient1.append("stop").attr("offset", "0%").attr("stop-color", "red");
        gradient1.append("stop").attr("offset", "25%").attr("stop-color", "orange");
        gradient1.append("stop").attr("offset", "75%").attr("stop-color", "green");

然后在路径中,您可以这样定义渐变:
 var path = svg.selectAll("path")
        .data(data)
        .enter()
        .append("path")
        .style("fill", function(d, i) {
          if (i == 0) {
            return d[2];
          } else {
            return "url(#gradient1)";
          }
        })

这里是有效的代码,点击这里查看。

希望这能有所帮助!


1
@OamPsy SVG并不支持这个功能。你可以使用线性渐变或径向渐变,但都不能让你在形状上设置渐变。要实现你想要的效果,可能需要在画布中编写代码。 - Robert Longson
@RobertLongson - 我明白了,谢谢您的解释。好的,我想我需要一个画布。我会更新标题的。 - Oam Psy
我认为这是可能的唯一原因是因为这个例子:http://codepen.io/sixsided/pen/ZYdZvG - Oam Psy
1
@OamPsy 这是一个线性渐变,可以看到它关于x轴对称。这符合你的要求吗? - Robert Longson
@OamPsy 我已经更新了我的答案,请查看 EDIT 部分,其中的渐变效果与示例 http://codepen.io/sixsided/pen/ZYdZvG 中的一样,您可以根据需要更改停止百分比。 - Cyril Cherian
显示剩余2条评论

2

i want to do is have the SVG change its colours smoothly from:

0% - 33.3% - red
33.4% - 66.66% - orange
66.7% - 100% green
假设您想要这样的颜色过渡/比例尺:

enter image description here

请看这个可工作的代码:http://codepen.io/anon/pen/vLVmyV 你可以使用d3线性比例尺来平滑地进行颜色过渡,像这样:
//Create a color Scale to smothly change the color of the donut
var colorScale = d3.scale.linear().domain([0,33.3,66.66,100]).range(['#cc0000','#ffa500','#ffa500','#00cc00']);

然后,当您使用attrTween更新路径以进行填充动画时,请仅获取表示甜甜圈填充部分的路径,我们称其为colorPath,并在 tween 中添加以下内容更改其填充:
//Set the color to the path depending on its percentage
//using the colorScale we just created before
colorPath.style('fill',colorScale(i2(t)))

您的attrTween会像这样:
colorPath.data([[0,percent,color]])
.transition(200).duration(2150).ease('linear')
.attrTween("d", function (a) {
    var i  = d3.interpolate(this._current, a);
    var i2 = d3.interpolate(progress, percent)
    this._current = i(0);
    // console.log(this._current);
    return function(t) {
        text.text( format(i2(t) / 100) );
        colorPath.style('fill',colorScale(i2(t)))
        return arc(i(t));
    };
});

请注意,我们仅更新colorPath的数据: colorPath.data([[0,percent,color]]) 完整的工作示例在这里:http://plnkr.co/edit/ox82vGxhcaoXJpVpUel1?p=preview

@OamPsy 非常感谢,如果可以的话请接受作为正确答案,谢谢。 - kevinkl3

网页内容由stack overflow 提供, 点击上面的
可以查看英文原文,
原文链接