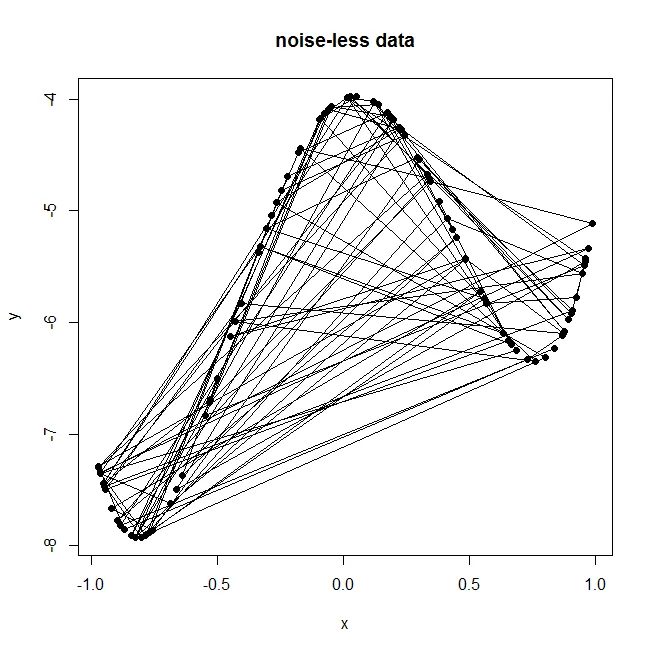
我在R编程语言的plot函数中遇到了一个简单的问题。我想要在点之间绘制一条线(参见此链接和如何在R中绘图),但我得到了一些奇怪的结果。我只希望连接一个点和另一个点,以便我可以连续地看到函数,但在我的图中,点与其他一些点随机连接。请参见第二张图。
下面是代码:
x <- runif(100, -1,1) # inputs: uniformly distributed [-1,1]
noise <- rnorm(length(x), 0, 0.2) # normally distributed noise (mean=0, sd=0.2)
f_x <- 8*x^4 - 10*x^2 + x - 4  # f(x), signal without noise
y <- f_x + noise # signal with noise

# plots
x11()
# plot of noisy data (y)
plot(x, y, xlim=range(x), ylim=range(y), xlab="x", ylab="y",
     main = "observed noisy data", pch=16)

x11()
# plot of noiseless data (f_x)
plot(x, f_x, xlim=range(x), ylim=range(f_x), xlab="x", ylab="y",
     main = "noise-less data",pch=16)
lines(x, f_x, xlim=range(x), ylim=range(f_x), pch=16)

# NOTE: I have also tried this (type="l" is supposed to create lines between the points in the right order), but also not working:
plot(x, f_x, xlim=range(x), ylim=range(f_x), xlab="x", ylab="y",
     main = "noise-less data", pch=16, type="l")
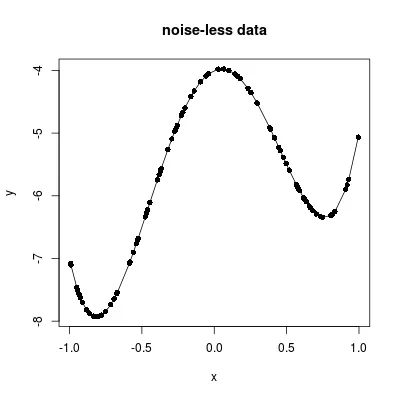
第一个图是正确的: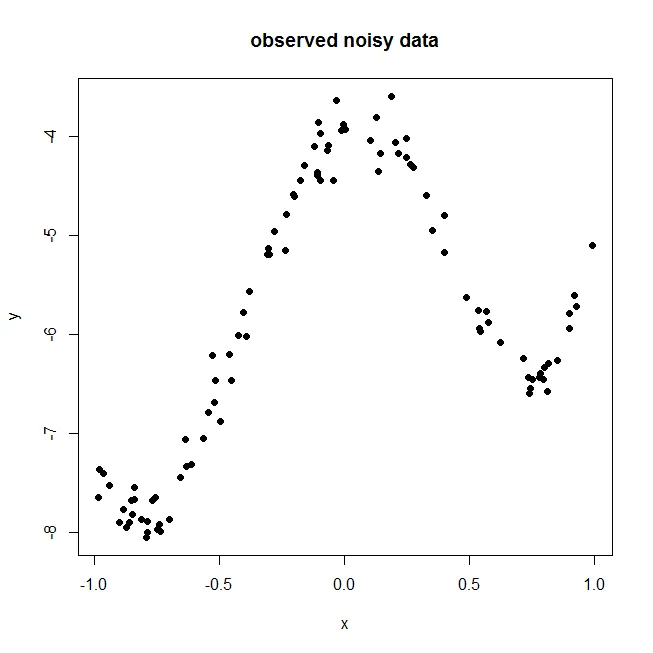 而第二个图并不是我想要的,我想要一个连续的图: