如何在d3上为力导向图添加标签?

3
我正在使用d3.js创建一个力导向图,但无法让节点显示文本标签。我已经尝试了StackOverflow上的无数答案和在线教程,但我认为问题在于我的基本JavaScript理解。 在此输入图片描述 我已经尝试了不同的.attr/.append/.text组合来获取源和目标的文本内容,但从未成功。
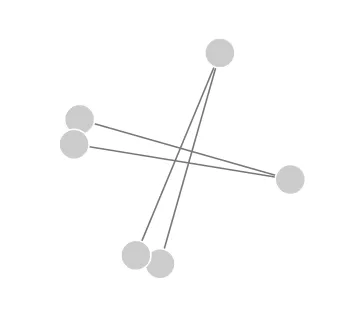
这是需要处理的区域:
node.append("title")
    .text(function (d) {return d.target});

node.append("text")
    .attr("dy", -3)
    .text(function (d) {return d.source})
    .attr("class", "font");

这是样式的简化摘录:

<style>

.node {
    fill: #ccc; /* Fill of the circles*/
    stroke: #ffffff;
    stroke-width: 2px;
}

.font {
    font: 10px;
    font-family: sans-serif;

}

.link {
    stroke: #777; /* Colour of the lines*/
    stroke-width: 2px;
}
</style>

这是脚本的简化摘录:

var width = 640,
    height = 480;

    var links = [
    //this is an array
    {source: "Germany", target: "name1"},
    {source: "Germany", target: "name2"},
    {source: "Nigeria", target: "name3"},
    {source: "Environment", target: "name4"},

    ]; 

    //setting up the nodes:

    var nodes = {};


    links.forEach(function(link){
        link.source = nodes[link.source] || 
            (nodes[link.source] = {name: link.source});
        link.target = nodes[link.target] ||
            (nodes[link.target] = {name: link.target});    
    });


//add svg to the body, this is where the actual d3 starts

var svg = d3.select("body").append("svg")
    .attr("width", width)
    .attr("height", height);

var force = d3.layout.force() //Here we specify the paramaters
    .size([width,height])
    .nodes(d3.values(nodes)) //this is where we pass the nodes of our dataset
    .links(links) // source of links
    .on("tick", tick) //on click of the nodes
    .linkDistance(300) //How far apart the nodes are
    .start(); //Start to render

//add link and nodes
var link = svg.selectAll(".link")
    .data(links) //get the data
    .enter().append('line') //binds the data in the links array to the svg 
    .attr("class", "link") //css styling

var node = svg.selectAll(".node")
    .data(force.nodes()) //way to reference the nodes in the force layout
    .enter().append("circle") 
    .attr("class", "node") //attribute CSS styling
    .attr("r", width * 0.03); //radius of the circle

//text element
node.append("title")
    .text(function (d) {return d.target});

node.append("text")
    .attr("dy", -3)
    .text(function (d) {return d.source})
    .attr("class", "font");

//creating the tick function from the force variable
//the "e" paramater can be used for positioning

function tick(e) {
    node.attr("cx", function(d) {return d.x;}) 
        .attr("cy", function(d) {return d.y;})
        .call(force.drag); //the relative location will activate a drag once the node is clicked

    link.attr("x1", function(d) { return d.source.x; }) 
        .attr("y1", function(d) { return d.source.y; })
        .attr("x2", function(d) { return d.target.x; })
        .attr("y2", function(d) { return d.target.y; })

    }
</script>

我目前没有收到任何错误信息,这使得我很难调试文件。非常感谢您的帮助。

1个回答

4

你的代码存在两个问题。

第一个问题是你的node选择:

var node = svg.selectAll(".node")
    .data(force.nodes())
    .enter().append("circle") 
    //etc...

你可以看到,这是一组圆形的选择。稍后,当你尝试...

node.append("text")

...这样做不起作用,因为您无法将<text>元素附加到<circle>元素。

最常见的解决方法是将node设置为组(<g>)选择器,然后将圆和文本都附加到该选择器上。

第二个问题是节点的数据。您在文本中拥有这些数据:

node.append("text")
    .text(function (d) {return d.source})

然而,数据中没有名为source的属性。您所拥有的唯一属性是name

以下是更改后的代码:

var width = 640,
  height = 480;

var links = [
  //this is an array
  {
    source: "Germany",
    target: "name1"
  },
  {
    source: "Germany",
    target: "name2"
  },
  {
    source: "Nigeria",
    target: "name3"
  },
  {
    source: "Environment",
    target: "name4"
  },

];

//setting up the nodes:

var nodes = {};


links.forEach(function(link) {
  link.source = nodes[link.source] ||
    (nodes[link.source] = {
      name: link.source
    });
  link.target = nodes[link.target] ||
    (nodes[link.target] = {
      name: link.target
    });
});


//add svg to the body, this is where the actual d3 starts

var svg = d3.select("body").append("svg")
  .attr("width", width)
  .attr("height", height);

var force = d3.layout.force() //Here we specify the paramaters
  .size([width, height])
  .nodes(d3.values(nodes)) //this is where we pass the nodes of our dataset
  .links(links) // source of links
  .on("tick", tick) //on click of the nodes
  .linkDistance(300) //How far apart the nodes are
  .start(); //Start to render

//add link and nodes
var link = svg.selectAll(".link")
  .data(links) //get the data
  .enter().append('line') //binds the data in the links array to the svg 
  .attr("class", "link") //css styling

var node = svg.selectAll(".node")
  .data(force.nodes()) //way to reference the nodes in the force layout
  .enter().append("g");

node.append("circle")
  .attr("class", "node")
  .attr("r", width * 0.03); //radius of the circle

node.append("text")
  .attr("dy", -3)
  .text(function(d) {
    return d.name
  })
  .attr("class", "font");

//creating the tick function from the force variable
//the "e" paramater can be used for positioning

function tick(e) {
  node.attr("transform", function(d) {
      return "translate(" + [d.x, d.y] + ")"
    })
    .call(force.drag); //the relative location will activate a drag once the node is clicked

  link.attr("x1", function(d) {
      return d.source.x;
    })
    .attr("y1", function(d) {
      return d.source.y;
    })
    .attr("x2", function(d) {
      return d.target.x;
    })
    .attr("y2", function(d) {
      return d.target.y;
    })

}
.node {
  fill: #ccc;
  /* Fill of the circles*/
  stroke: #ffffff;
  stroke-width: 2px;
}

.font {
  font: 10px;
  font-family: sans-serif;

}

.link {
  stroke: #777;
  /* Colour of the lines*/
  stroke-width: 2px;
}
<script src="https://cdnjs.cloudflare.com/ajax/libs/d3/3.5.17/d3.min.js"></script>


网页内容由stack overflow 提供, 点击上面的
可以查看英文原文,
原文链接