强制 R 使用上标输出科学计数法表示为 n.nn x 10^-n 的形式

3

假设我有两个浮点数

a <- 8.9384920e-24
b <- 0.00293892837

我想在图表上显示这两个数之一,以10进制科学计数法四舍五入到小数点后两位,可能使用paste()函数,但要在10后面使用上标格式。

8.94 x 10^-24 #no ^ and superscript font
2.94 x 10^-4  #no ^ and supercript font, should be -4, not -04

这真的很疯狂,但它是由上级要求的,在基本R中必须完成(而不是ggplot2),否则我将不得不重新编写600行代码...现在我所能看到的是,无论浮点数有多大,它们的打印方式都不同...
1个回答

6
您可以在sfsmisc包中检查eaxis
# some data
x <- seq(1, 100000, len = 10)
y <- seq(1e-5, 1e-4, len = 10)

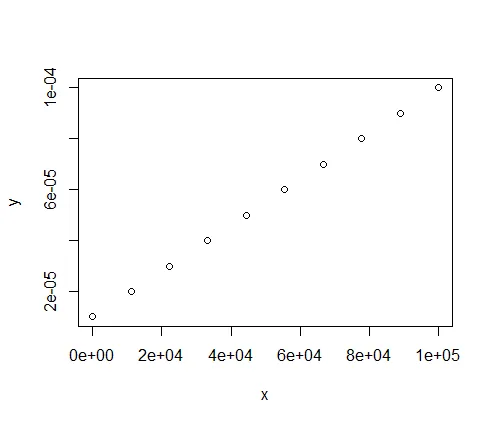
# default axes
plot(x, y)

enter image description here

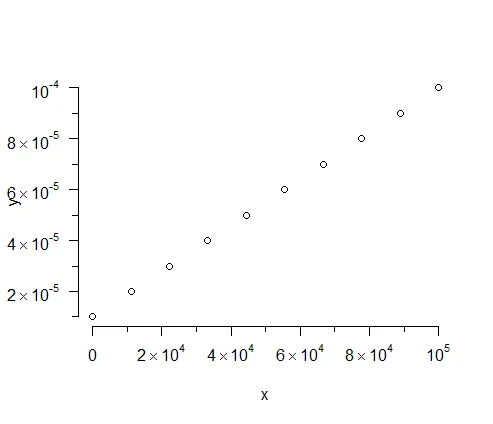
# eaxis
plot(x, y, axes = FALSE)
eaxis(side = 1)
eaxis(side = 2)

enter image description here

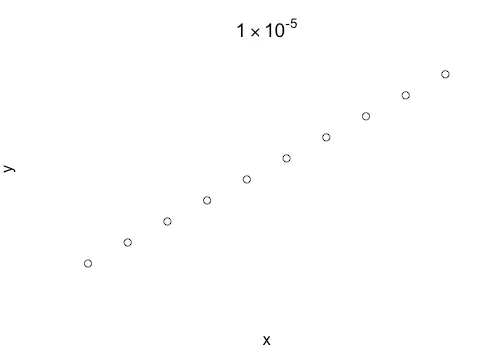
您还可以使用同一软件包中的pretty10exp()创建标签expression。例如,将格式应用于绘图标题:

plot(x, y, axes = FALSE)
title(pretty10exp(y[1]))

enter image description here


这非常好,虽然在起初我只是想将其用于一个变量而不是轴上。但由于你的回复,我得以检查 sfsmisc 包并找到了 pretty10exp() 函数,它正是我想要的!我冒昧地编辑了你的回答,加入了 pretty10exp(),这样可以吗? - biohazard

网页内容由stack overflow 提供, 点击上面的
可以查看英文原文,
原文链接