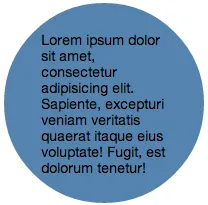
function createChart(lines, lineHeight) {
const width = 180;
const height = width;
const radius = Math.min(width, height) / 2 - 4;
const svg = d3
.select("#graph")
.append("svg")
.style("font", "10px sans-serif")
.style("width", "500px")
.style("height", "500px")
.attr("text-anchor", "middle");
svg
.append("circle")
.attr("cx", width / 2)
.attr("cy", height / 2)
.attr("fill", "#ccc")
.attr("r", radius);
svg
.append("text")
.attr(
"transform",
`translate(${width / 2},${height / 2}) scale(${
radius / textRadius(lines, lineHeight)
})`
)
.selectAll("tspan")
.data(lines)
.enter()
.append("tspan")
.attr("x", 0)
.attr("y", (d, i) => (i - lines.length / 2 + 0.8) * lineHeight)
.text((d) => d.text);
return svg.node();
}
function textRadius(lines, lineHeight) {
let radius = 0;
for (let i = 0, n = lines.length; i < n; ++i) {
const dy = (Math.abs(i - n / 2 + 0.5) + 0.5) * lineHeight;
const dx = lines[i].width / 2;
radius = Math.max(radius, Math.sqrt(dx ** 2 + dy ** 2));
}
return radius;
}
function createWords(text) {
const words = text.split(/\s+/g);
if (!words[words.length - 1]) words.pop();
if (!words[0]) words.shift();
return words;
}
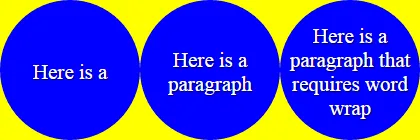
function createLines(words) {
let line;
let lineWidth0 = Infinity;
const lines = [];
for (let i = 0, n = words.length; i < n; ++i) {
let lineText1 = (line ? line.text + " " : "") + words[i];
let lineWidth1 = measureWidth(lineText1);
if ((lineWidth0 + lineWidth1) / 2 < targetWidth) {
line.width = lineWidth0 = lineWidth1;
line.text = lineText1;
} else {
lineWidth0 = measureWidth(words[i]);
line = { width: lineWidth0, text: words[i] };
lines.push(line);
}
}
return lines;
}
function measureWidth(text) {
const ctx = document.createElement("canvas").getContext("2d");
return ctx.measureText(text).width;
}
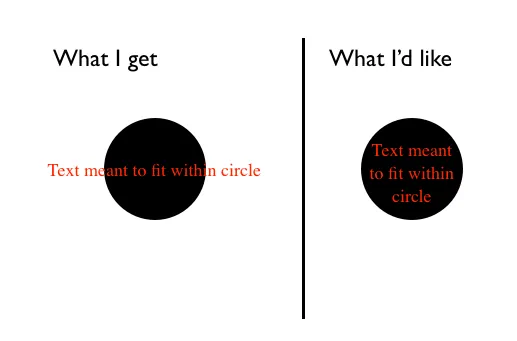
const text =
"Hello! This notebookshows how to wrap andfit text inside a circle. Itmight be useful forlabelling a bubble chart.You can edit the textbelow, or read the notesand code to learn howit works! ";
const lineHeight = 12;
const targetWidth = Math.sqrt(measureWidth(text.trim()) * lineHeight);
const lines = createLines(createWords(text));
createChart(lines, lineHeight);
 <head>
    <script
      src="https://cdnjs.cloudflare.com/ajax/libs/d3/7.1.1/d3.min.js"
      crossorigin="anonymous"
      referrerpolicy="no-referrer"
    ></script>
  </head>

<body>
    <div id="graph"></div>
  </body>