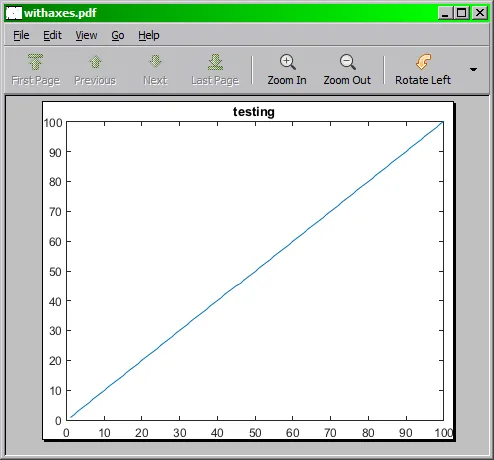
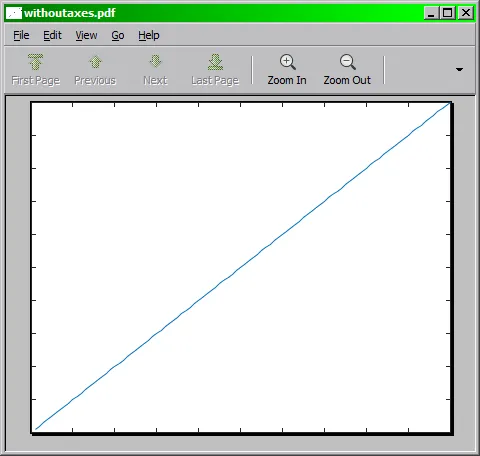
我想在LaTeX文档中使用matlab图形的PDF版本。 我正在使用“saveas”命令并选择PDF选项保存图形,但是在pdf文件中,我的图形周围有大量的空白区域。 这是正常的吗? 我该如何摆脱它? 当然要自动完成,因为我有很多绘图。
出版用图形导出是一个很好的起点。使用-dpdf而不是-deps来输出pdf文件。
你可以使用下面的代码解决边界框问题。
set(gcf, 'PaperSize', [6.25 7.5]);
set(gcf, 'PaperPositionMode', 'manual');
set(gcf, 'PaperPosition', [0 0 6.25 7.5]);

set(gcf, 'PaperUnits', 'inches');
set(gcf, 'PaperSize', [6.25 7.5]);
set(gcf, 'PaperPositionMode', 'manual');
set(gcf, 'PaperPosition', [0 0 6.25 7.5]);

set(gcf, 'renderer', 'painters');
print(gcf, '-dpdf', 'my-figure.pdf');
print(gcf, '-dpng', 'my-figure.png');
print(gcf, '-depsc2', 'my-figure.eps');
您可以在Tobin的文章中了解更多相关信息。
1
以上的答案看起来过于复杂。这个函数使用一个图形句柄和一个字符串,在不占用太多边距的情况下将内容打印到PDF文件中。
function printpdf(h,outfilename)

set(h, 'PaperUnits','centimeters');
set(h, 'Units','centimeters');
pos=get(h,'Position');
set(h, 'PaperSize', [pos(3) pos(4)]);
set(h, 'PaperPositionMode', 'manual');
set(h, 'PaperPosition',[0 0 pos(3) pos(4)]);
print('-dpdf',outfilename);
例如,要打印当前图形,您可以使用以下代码调用:
printpdf(gcf,'trash')
然而,如果你真的想要一个类似于Matlab生成的eps格式的pdf图像,也就是说,只需要绘制(或一组子图)的矩形凸包,那么这里有一个更复杂的版本:
function printpdf(h,outfilename)

% first use the same non-relative unit system for paper and screen (see
% below)
set(h,'PaperUnits','centimeters');

% now get all existing plots/subplots
a=get(h,'Children');
nfigs=length(a);

% bounds will contain lower-left and upper-right corners of plots plus one
% line to make sure single plots work
bounds=zeros(nfigs+1,4);
bounds(end,1:2)=inf;
bounds(end,3:4)=-inf;

% generate all coordinates of corners of graphs and store them in
% bounds as [lower-left-x lower-left-y upper-right-x upper-right-y] in
% the same unit system as paper (centimeters here)
for i=1:nfigs
    set(a(i),'Unit','centimeters');
    pos=get(a(i),'Position');
    inset=get(a(i),'TightInset');
    bounds(i,:)=[pos(1)-inset(1) pos(2)-inset(2) ...
        pos(1)+pos(3)+inset(3) pos(2)+pos(4)+inset(4)];
end

% compute the rectangular convex hull of all plots and store that info
% in mypos as [lower-left-x lower-left-y width height] in centimeters
auxmin=min(bounds(:,1:2));
auxmax=max(bounds(:,3:4));
mypos=[auxmin auxmax-auxmin];

% set the paper to the exact size of the on-screen figure using
% figure property PaperSize [width height]
set(h,'PaperSize',[mypos(3) mypos(4)]);

% ensure that paper position mode is in manual in order for the
% printer driver to honor the figure properties
set(h,'PaperPositionMode', 'manual');

% use the PaperPosition four-element vector [left, bottom, width, height]
% to control the location on printed page; place it using horizontal and
% vertical negative offsets equal to the lower-left coordinates of the
% rectangular convex hull of the plot, and increase the size of the figure
% accordingly
set(h,'PaperPosition',[-mypos(1) -mypos(2) ...
    mypos(3)+mypos(1) mypos(4)+mypos(2)]);

% print stuff
print('-dpdf',outfilename);
1
除了其他建议之外,您还可以尝试使用LooseInset属性,如http://UndocumentedMatlab.com/blog/axes-looseinset-property/中所述,以删除绘图坐标轴周围的额外空间。
1
在找到简单的解决方法之前,我曾经为此苦苦挣扎过。将文件保存为.eps格式,然后将.eps转换为.pdf格式。在Mac OS上,可以使用预览程序来完成这个操作。
convert -trim input.png input-trimmed.png
这需要使用imagemagick。
更新:对于我最近的所有出版物,我使用https://github.com/altmany/export_fig,这是我迄今发现的最佳解决方案(连同其他单一软件包中的其他问题的许多解决方案)。我认为至少应该有一个与此同样强大的工具成为Matlab的官方部分。我将其用作:
export_fig -transparent fig.pdf
该命令可以导出当前图形,默认情况下会进行裁剪。
需要安装Ghostscript
1
我刚刚花了一些时间尝试了这些选项中的大部分,但我的朋友Espen指出了最简单的方法:如果您在LaTeX中使用graphicx包,则选择标准的Matlab pdf输出,并在\includegraphics中使用trim选项。以下是Beamer幻灯片的示例:
\includegraphics[trim = 0.1in 2.5in 0.1in 2.5in, clip, scale=0.5]{matlabgraphic.pdf}
这里的trim参数顺序是左、下、右、上。关键是要大量修剪顶部和底部以去除多余空间。更多信息请参见Wikibooks。
1
你可以通过MATLAB来完成这个操作:
h = figure; % For example, h = openfig('sub_fig.fig'); Or you just ploted one figure: plot(1:10);
set(h,'Units','Inches');
pos = get(h,'Position');
set(h,'PaperPositionMode','Auto','PaperUnits','Inches','PaperSize',[pos(3),pos(4)]);
print(h,'your_filename','-dpdf','-r0');
希望这有所帮助。
我最喜欢@Antonio的方法,但它仍然留下了太多的空白,而且我正在寻找一个可以导出矢量pdf以供在LaTeX中使用的单一绘图解决方案。
我基于他的脚本制作了一些东西,并添加了只导出绘图框(省略轴)的选项。
请注意,与Antonio的脚本不同,这仅适用于没有子图的图片。
下面的代码将导出任何单一绘图句柄作为矢量PDF,无论是否带轴。
function SaveFigureAsVectorPDF(InputFigureHandle, OutFileName, ShouldPrintAxes)
    %% Check input parameters
    [NumberOfFigures, ~] = size(InputFigureHandle);

    if(NumberOfFigures ~= 1)
        error('This function only supports one figure handle.');

    end

    if(isempty(OutFileName))
        error('No file path provided to save the figure to.');

    end

    cUnit = 'centimeters';

    %% Copy the input figure so we can mess with it
    %Make a copy of the figure so we don't modify the properties of the
    %original.
    FigureHandleCopy = copy(InputFigureHandle);

    %NOTE:  Do not set this figure to be invisible, for some bizarre reason
    %       it must be visible otherwise Matlab will just ignore attempts
    %       to set its properties.
    %
    %       I would prefer it if the figure did not briefly flicker into
    %       view but I am not sure how to prevent that.

    %% Find the axis handle
    ChildAxisHandles     = get(FigureHandleCopy, 'Children');
    NumberOfChildFigures = length(ChildAxisHandles);

    if(NumberOfChildFigures ~= 1)
       %note that every plot has at least one child figure
       error('This function currently only supports plots with one child figure.');

    end

    AxisHandle = ChildAxisHandles(1);

    %% Set Units
    % It doesn't matter what unit you choose as long as it's the same for
    % the figure, axis, and paper. Note that 'PaperUnits' unfortunately
    % does not support 'pixels' units.

    set(FigureHandleCopy,   'PaperUnits',   cUnit);
    set(FigureHandleCopy,   'Unit',         cUnit);
    set(AxisHandle,         'Unit',         cUnit);

    %% Get old axis position and inset offsets
    %Note that the axes and title are contained in the inset
    OldAxisPosition = get(AxisHandle,   'Position');
    OldAxisInset    = get(AxisHandle,   'TightInset');

    OldAxisWidth    = OldAxisPosition(3);
    OldAxisHeight   = OldAxisPosition(4);

    OldAxisInsetLeft    = OldAxisInset(1);
    OldAxisInsetBottom  = OldAxisInset(2);
    OldAxisInsetRight   = OldAxisInset(3);
    OldAxisInsetTop     = OldAxisInset(4);

    %% Set positions and size of the figure and the Axis
    if(~ShouldPrintAxes)

        FigurePosition = [0.0, 0.0, OldAxisWidth, OldAxisHeight];

        PaperSize = [OldAxisWidth, OldAxisHeight];

        AxisPosition = FigurePosition;

    else
        WidthWithInset  = OldAxisWidth   + OldAxisInsetLeft + OldAxisInsetRight;
        HeightWithInset = OldAxisHeight  + OldAxisInsetTop  + OldAxisInsetBottom;

        FigurePosition = [0.0, 0.0, WidthWithInset,  HeightWithInset];

        PaperSize = [WidthWithInset, HeightWithInset];

        AxisPosition = [OldAxisInsetLeft, OldAxisInsetBottom, OldAxisWidth, OldAxisHeight];

    end

    set(FigureHandleCopy,   'Position', FigurePosition);
    set(AxisHandle,         'Position', AxisPosition);

    %Note:  these properties do not effect the preview but they are
    %       absolutely necessary for the pdf!!
    set(FigureHandleCopy,   'PaperSize',        PaperSize);
    set(FigureHandleCopy,   'PaperPosition',    FigurePosition);

    %% Write the figure to the PDF file
    print('-dpdf', OutFileName);

    set(FigureHandleCopy, 'name', 'PDF Figure Preview', 'numbertitle', 'off');

    %If you want to see the figure (e.g., for debugging purposes), comment
    %the line below out.
    close(FigureHandleCopy);

end
示例图像:
带坐标轴:
不带坐标轴:
测试代码:
%% Generates a graph and saves it to pdf

FigureHandle = figure;

plot(1:100);

title('testing');

%with axes
SaveFigureAsVectorPDF(FigureHandle, 'withaxes.pdf', true);

%without axes
SaveFigureAsVectorPDF(FigureHandle, 'withoutaxes.pdf', false);
1
我在MATLAB的文件交换平台上找到了Jürg Schwizer提供的一个非常有用的函数:
plot2svg( filename, figHandle );
将图形输出为矢量图形(.svg),并将各个图形组件作为像素图形(默认为.png)。这使您可以对图形进行各种操作(删除标签,移动颜色条等),但如果您想要删除白色背景,则只需使用inkscape打开.svg文件,取消组合项目,并将您感兴趣的项目导出为新的图形即可。
对于使用Linux的用户,一个非常简单的解决方案是在shell中编写以下命令: ps2pdf14 -dPDFSETTINGS=/prepress -dEPSCrop image.eps
原文链接

