在R中,我使用
expression(theta[l])来使我的图表轴标签与LaTeX中的$\theta_l$相同。出于美学原因,我更愿意显示$\theta_\ell$。你能帮我吗?

编辑
以前,我做过这样的操作
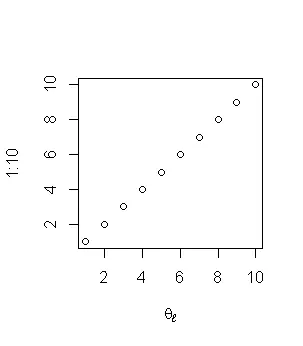
plot(1:10, 1:10, xlab=expression(theta[l]))
我将生成的图片导出为pdf文件。然后,使用
\begin{figure}[htbp]
\centerline{\includegraphics[scale=.6]{test.pdf}}
\end{figure}
我的照片被插入到LaTeX中。
根据评论,这是我现在所做的事情:
require(tikzDevice)
tikz("test.tex", standAlone=TRUE, width=5, height=5)

plot(1:10, 1:10, xlab="$\\theta_\\ell$")

dev.off()
tools::texi2pdf('test.tex')
system(paste(getOption('pdfviewer'),'test.pdf'))
然而,当我将生成的图表插入到LaTeX中时,图像质量不如以前那么好。我还能做些什么吗?
cairo_pdf:plot(1:10, main ="\u2113")。编辑:我刚意识到你想要theta_ell,那可能没有帮助... - Jouni Helske