在画布上绘制正弦波

12

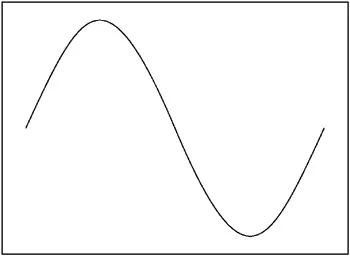
我想在画布上绘制一个简单的正弦波,但是我做得不对。这是我期望的输出结果,如图片所示。

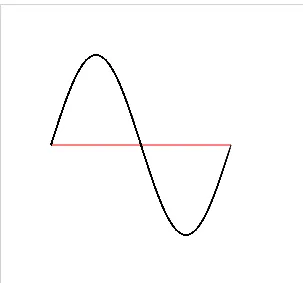
目前我所得到的是http://jsfiddle.net/RaoBurugula/gmhg61s6/4/

HTML

 <canvas id="myCanvas" width="360" height="360" style="border:1px solid #d3d3d3;">

JS

 var c = document.getElementById("myCanvas");
 var ctx = c.getContext("2d");
 var i;
 for(i=0; i<360; i+= 20){
    ctx.moveTo(i+5,180);
    ctx.lineTo(i,180);

 }
 ctx.stroke();
 var counter = 0, x=0,y=180;

 //100 iterations
 var increase = 90/180*Math.PI ;
 for(i=0; i<=180; i+=10){

 ctx.moveTo(x,y);
 x = i;
y=  180 - Math.sin(counter);
counter += increase;

ctx.lineTo(x,y);
alert( " x : " + x + " y : " + y) ;
}
ctx.stroke();

我期望的输出

我期望的输出


你每次只是将计数器增加 PI/2,这样做不会有太大的作用。 - rghome
8个回答

10

你正在使用一个过大的值增加 counter,请将其缩小:

var increase = 90/180*Math.PI / 9;

绘制整个图表的宽度,而不是一半:

for(i=0; i<=360; i+=10){

你需要更大的振幅:

y =  180 - Math.sin(counter) * 120;

演示:http://jsfiddle.net/Guffa/gmhg61s6/5/


嗨,Guffa,如果我想添加一个超时时间以逐步查看它的绘图过程,我该如何做呢?谢谢。 - BRDroid
@Rao:你可以使用一个带有setTimeout的调用自身的函数来代替循环:http://jsfiddle.net/Guffa/gmhg61s6/9/ - Guffa
@Guffa 这太棒了!它帮助我创建了我的曲线,但我也想尝试给它添加动画效果,你有什么建议吗? - felixo

10

虽为老问题,但具有普遍的兴趣。

这里的所有回答都非常有用,但没有一个拥有精心注释的代码,因此我创建了一个片段,解释了每个点发生的事情,并绘制了许多变量以增强清晰度。感谢大家的帮助,我希望这可以帮助其他人。

var c = document.getElementById("canvas"); // Grab canvas object
var ctx = c.getContext("2d"); // Define canvas context
var w=c.width; // Canvas width => Frequency is relative to this
var h=c.height/2; // Canvas height over two => Amplitude: Volume
var f=1; // How many cycles per canvas width => Frequency: Tone & Speed
// Calculates y position from x
function calcSineY(x) {
 // This is the meat (unles you are vegan)
  // Note that:
  // h is the amplitude of the wave
  // x is the current x value we get every time interval
  // 2 * PI is the length of one cycle (full circumference)
  // f/w is the frequency fraction
 return h - h * Math.sin( x * 2 * Math.PI * (f/w) );
}
function drawSine(x){
 ctx.clearRect(0, 0, w, h*2);
  //draw x axis
  ctx.beginPath(); // Draw a new path
  ctx.strokeStyle = "green"; // Pick a color
  ctx.moveTo(0,h); // Where to start drawing
  ctx.lineTo(w,h); // Where to draw to
  ctx.stroke(); // Draw
  
  // draw horizontal line of current amplitude
  ctx.beginPath(); // Draw a new path
  ctx.moveTo(0,h); // Where to start drawing
  ctx.strokeStyle = "gray"; // Pick a color
  for(var i=0;i<x;i++){ // Loop from left side to current x
    var y = calcSineY(x); // Calculate y value from x
   ctx.moveTo(i,y); // Where to start drawing
    ctx.lineTo(x,y); // Where to draw to
  }
  ctx.stroke(); // Draw
  
  // draw amplitude bar at current point
  ctx.beginPath(); // Draw a new path
  ctx.strokeStyle = "red"; // Pick a color
  for(var i=0;i<x;i++){ // Loop from left side to current x
    var y = calcSineY(x); // Calculate y value from x
   ctx.moveTo(x,h); // Where to start drawing
    ctx.lineTo(x,y); // Where to draw to
  }
  ctx.stroke(); // Draw
  
  // draw area below y
  ctx.beginPath(); // Draw a new path
  ctx.strokeStyle = "orange"; // Pick a color
  for(var i=0;i<x;i++){ // Loop from left side to current x
    if(i/3==Math.round(i/3)) { // Draw only one line each 3 pixels
      var y = calcSineY(i); // Calculate y value from x
      ctx.moveTo(i,h); // Where to start drawing
      ctx.lineTo(i,y); // Where to draw to
    }
  }
  ctx.stroke(); // Draw
  
  // draw sin curve point to point until x
  ctx.beginPath(); // Draw a new path
  ctx.strokeStyle = "black"; // Pick a color
  for(var i=0;i<x;i++){ // Loop from left side to current x
    var y = calcSineY(i); // Calculate y value from x
    ctx.lineTo(i,y); // Where to draw to
  }
  ctx.stroke(); // Draw
}
// Define initial value of x positiom (leftmost side of cnanvas)
var x=0;
// Start time interval
var interval = setInterval(function(){
 drawSine(x); // Call draww function every cycle
 x++; // Increment x by 1
 if(x>w){
     x=0; // x cannot be more than canvas with, so back to 0
        f++; // increment frequency for demonstration
    }
},10); // Loop every 10 milliseconds
<canvas id="canvas" width="320" height="120" style="border:1px solid #999;">


5
使用 bezierCurveTo,这只是一个示例,您应该调整参数以获得漂亮的正弦曲线。

var c = document.getElementById("myCanvas");
var ctx = c.getContext("2d");
ctx.moveTo(50,50);
ctx.bezierCurveTo(120,-100,200,250,250,50);
ctx.bezierCurveTo(300,-100,350,250,430,50);
ctx.lineWidth = 5;
ctx.strokeStyle = '#003300';
ctx.stroke();
<canvas id="myCanvas" width="550" height="360" style="border:1px solid #d3d3d3;">


3

你的代码过于复杂。 尝试简化它:

    var c = document.getElementById("myCanvas"); // get the canvas object to draw onto
    var ctx = c.getContext("2d"); // will use simpe 2D context on the canvas
    
    for(x=0; x<360; x += 20) { // 360 steps for entire sine period
        ctx.moveTo(x+10,180);  // for dashed line, go to start of next dash
        ctx.lineTo(x,180);  // then draw the short line
    }
    ctx.moveTo(0,180);  // back to the left before drawing the sine
    
    for(x=0; x<=360; x+=1) { // 360 steps (degrees) for entire sine period
        y = 180.0 - Math.sin(x*Math.PI/180)*120; // calculate y flipped horizontally, converting from DEG to RADIAN
        ctx.lineTo(x,y); // draw the point
    }
    ctx.stroke(); // strokes the drawing to the canvas
<canvas id="myCanvas" width="360" height="360" style="border:1px solid #d3d3d3;">


3

基于bartpie的回答:

const l = 180; // length
const heightRatio = 2;
const tf = l * 2 / 5; // two fifths of length

const ctx = document.getElementById("canvas").getContext("2d");
ctx.translate(10, 100); // just for display


ctx.beginPath();
ctx.strokeStyle ='red';

ctx.moveTo(0,0);
ctx.lineTo(l,0);
ctx.stroke();

ctx.beginPath();
ctx.strokeStyle ='#000';

ctx.moveTo(0,0);
ctx.bezierCurveTo(tf,-(l*heightRatio-tf),l-tf,l*heightRatio-tf,l,0);

ctx.stroke();
<canvas id="canvas" width="200" height="220">


1

var c = document.getElementById("myCanvas");
var ctx = c.getContext("2d");
var i;
var amplitude = 90;
var width = c.width;
var height = c.height / 2;
var step = 1;
var frequency = 4;
ctx.moveTo(0, height);
ctx.lineTo(width, height);
ctx.stroke();
ctx.beginPath();
ctx.moveTo(0, height);
var c = width / Math.PI / (frequency * 2);

for (i = 0; i < width; i += step) {
  var x = amplitude * Math.sin(i / c);
  ctx.lineTo(i, height + x);
}

ctx.strokeStyle = '#0096FF';
ctx.stroke();
<canvas id="myCanvas" width="600" height="300" style="border:1px solid #d3d3d3;">


提供一些关于你的代码的解释可能会更有帮助。 - Charlie Fish

1

function plotSine(amplitude, frequency) {
  const canvas = document.getElementById('canvas');
  if (canvas.getContext) {
    const ctx = canvas.getContext('2d');
    
    ctx.clearRect(0, 0, canvas.width, canvas.height);
    
    ctx.beginPath();
    
    ctx.strokeStyle = '#343a40';
    ctx.lineWidth = 2;
    
    var x = 0;
    var y = 0;
    
    while (x < canvas.width) {
      y = (canvas.height / 2) + amplitude * Math.sin(x / frequency);
      ctx.lineTo(x, y);
      
      x += 1;
    }
    
    ctx.stroke();
  }
}

plotSine(40, 20);
code {
  background-color: #eee;
  border-radius: 3px;
  padding: 0 3px;
}
<canvas id="canvas" width="480" height="360">
  <p>
    Your browser does not support the <code>&lt;canvas&gt;</code> element.
  </p>
</canvas>


0

使用单循环结构,你可以轻松实现

var c = document.getElementById("myCanvas");
      var ctx = c.getContext("2d");
     var y=180;
      //draw axis
      ctx.beginPath();
      ctx.strokeStyle = "red";
      ctx.moveTo(0,  y/2);
      ctx.lineTo(y,  y/2);
      ctx.stroke();
      // draw sin wave
      ctx.beginPath();
      ctx.moveTo(x,y);
      ctx.strokeStyle = "black";
      for(var x=0; x<=180; x+=1){
          ctx.lineTo(x,((y/2)  + y/2  * Math.sin( ((x+-y/2)/90) * Math.PI)));
          ctx.stroke();
          }
<canvas id="myCanvas" width="360" height="360" style="border:1px solid #d3d3d3;">

https://istack.dev59.com/9oEN0.webp enter image description here


网页内容由stack overflow 提供, 点击上面的
可以查看英文原文,
原文链接