f = figure ( 'color', 'white' );
% create the axes and set some properties
ax = axes ( 'parent', f, 'box', 'off', 'nextplot', 'add', 'XMinorTick', 'on', 'YMinorTick', 'on' );
% plot some data
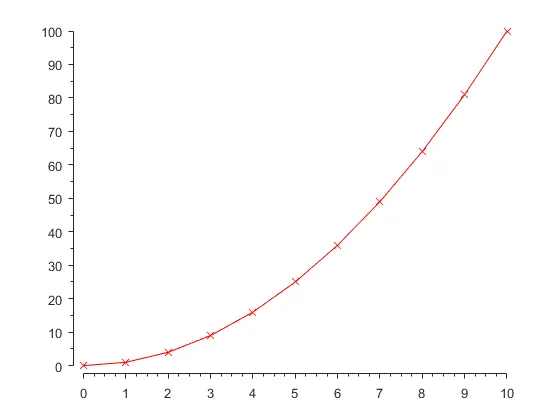
plot ( ax, 0:10, [0:10].^2, 'rx-' )
% modify the x and y limits to below the data (by a small amount)
ax.XLim(1) = ax.XLim(1)-(ax.XTick(2)-ax.XTick(1))/4;
ax.YLim(1) = ax.YLim(1)-(ax.YTick(2)-ax.YTick(1))/4;
% Set the tick direction
ax.TickDir = 'out';
% draw the plot to generate the undocumented vertex data var
drawnow()
%% R2015a
% X, Y and Z row of the start and end of the individual axle.
ax.XRuler.Axle.VertexData(1,1) = 0;
ax.YRuler.Axle.VertexData(2,1) = 0;
%% R2015b
% extract the x axis vertext data
% X, Y and Z row of the start and end of the individual axle.
vd = get(ax.XAxis.Axle,'VertexData');
% reset the zero value
vd(1,1) = 0;
% Update the vertex data
set(ax.XAxis.Axle,'VertexData',vd);
% repeat for Y (set 2nd row)
vd = get(ax.YAxis.Axle,'VertexData');
vd(2,1) = 0;
set(ax.YAxis.Axle,'VertexData',vd);
编辑:每当坐标轴/图形更改大小或缩放或平移时,顶点是Matlab重新创建的内容。
你可以尝试通过添加监听器来捕捉这个变化(请记住,此处使用了不记录在案的功能)。我们可以使用MarkedClean
事件,该事件被调用多次。
addlistener ( ax, 'MarkedClean', @(obj,event)resetVertex(ax) );
如果你的resetVertex函数类似于以下代码:(仅显示R2015b版本)
function resetVertex(ax)
% ...
end
编辑2:添加了关闭小于0的次刻度线的代码。
function resetVertex ( ax )
% extract the x axis vertext data
% X, Y and Z row of the start and end of the individual axle.
ax.XAxis.Axle.VertexData(1,1) = 0;
% repeat for Y (set 2nd row)
ax.YAxis.Axle.VertexData(2,1) = 0;
% You can modify the minor Tick values by modifying the vertex data
% for them, e.g. remove any minor ticks below 0
ax.XAxis.MinorTickChild.VertexData(:,ax.XAxis.MinorTickChild.VertexData(1,:)<0) = [];
ax.YAxis.MinorTickChild.VertexData(:,ax.YAxis.MinorTickChild.VertexData(2,:)<0) = [];
end
注意:此方法使用了未经文档记录的功能,因此可能仅适用于某些版本的Matlab(我已添加了r2015a和r2015b的代码),并且根据您对绘图所做的操作,Matlab可能会重新创建顶点数据。
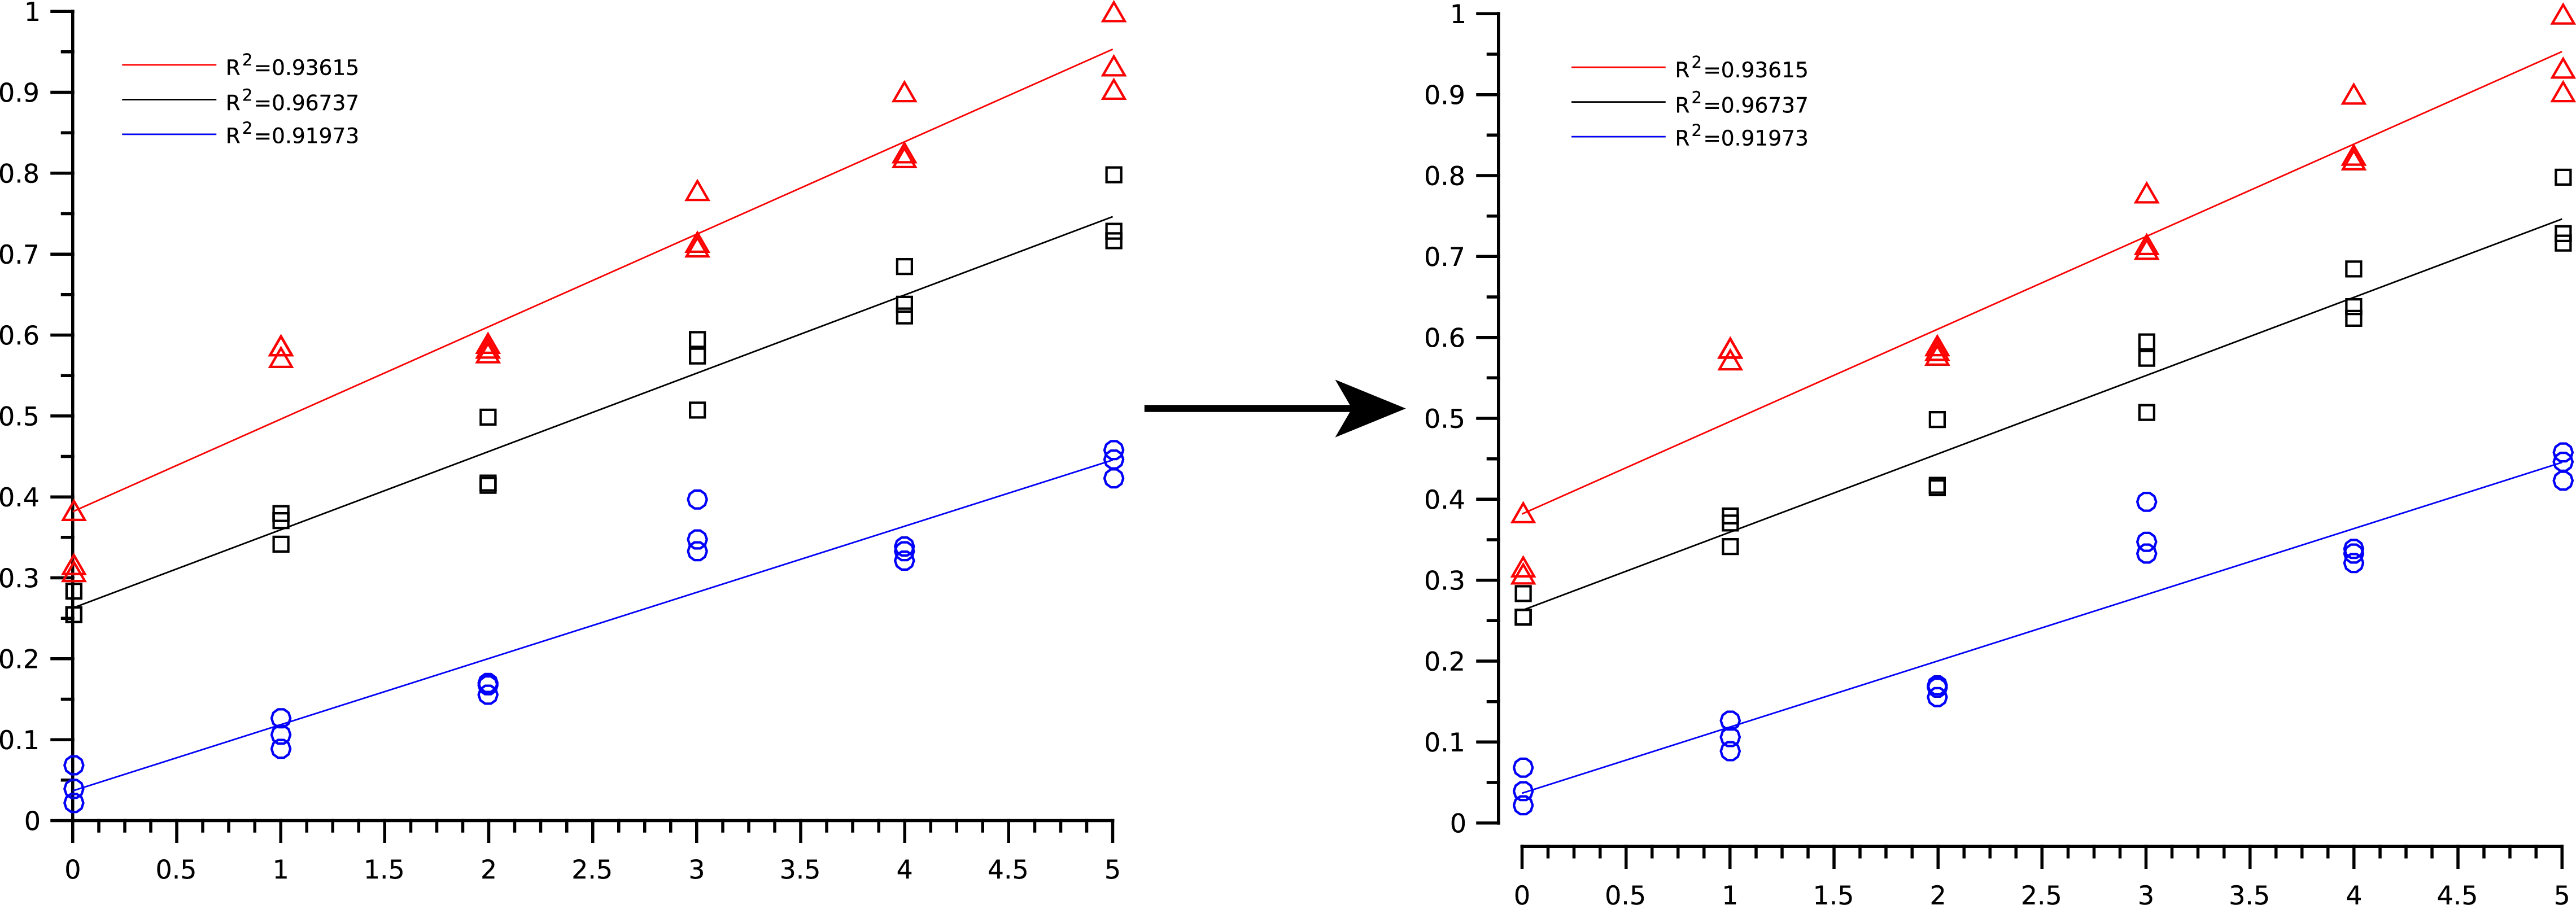
No appropriate method, property, or field 'XAxis' for class 'matlab.graphics.axis.Axes'.
- EBHax.XRuler.Axle.VertexData...
这一行代码并不能总是解决问题。 - EBH% some data:
x = 1:100;
f=@(x) 5.*x;
y=f(x)+rand(1,length(x))*50;
close all
% plotting:
f1 = figure('Color','white');
ax = axes;
plot(ax,x,y,'o');
% 'clean' the data area a little bit:
box off
ax.TickDir = 'out';
% pushing the axis a bit forward:
lims = axis;
pos = ax.Position;
axis([lims(1)-ax.XTick(2)/5 lims(2)+0.1 lims(3)-ax.YTick(2)/5 lims(4)+0.1])
% Create lines
firstXtick = 0.013; %this value need to be adjusted only once per figure
firstYtick = 0.023; %this value need to be adjusted only once per figure
lx = annotation(f1,'line',[pos(1) pos(1)+firstXtick],...
[pos(2) pos(2)],'Color',[1 1 1],'LineWidth',1);
ly = annotation(f1,'line',[pos(1) pos(1)],...
[pos(2) pos(2)+firstYtick],'Color',[1 1 1],'LineWidth',1);
firstXtick
和firstYtick
值,必须对特定坐标轴进行精细调整。设置正确值后,可以轻松调整图形大小。缩放和平移需要进行少量修补。注释
技巧! 我已经给它投了赞! - Sardar Usama您可以从小于零开始设置坐标轴,然后从图表中删除小于零的刻度。例如:
plot(0:3:30,0:3:30); %Some random data for plotting
h = gca;
axis([-1 30 -1 30]); %Setting the axis from less than zero
box off; %Removing box
h.TickDir = 'out'; %Setting Direction of ticks to outwards
h.XTickLabel(1)= {' '}; %Removing the first tick of X-axis
h.YTickLabel(1)= {' '}; %Removing the first tick of Y-axis
if
条件来避免这种情况。因此,代码可以修改为以下形式:plot(0:3:30,0:3:30);
h = gca;
axis([-1 30 -1 30]);
box off;
h.TickDir = 'out';
if str2num(cell2mat(h.XTickLabel(1))) <0
h.XTickLabel(1)= {' '};
end
if str2num(cell2mat(h.YTickLabel(1))) <0
h.YTickLabel(1)= {' '};
end
-1
可能不太适合作为轴起始值,您可能需要使用 -0.1
,即 axis([-0.1 30 -0.1 30]);
。通过对@matlabgui的答案进行轻微修改,您可以跟踪(主要)刻度限制:
ax = gca();
% Set the tick direction
ax.TickDir = 'out';
% Make sure this stays when saving, zooming, etc
addlistener ( ax, 'MarkedClean', @(obj,event) change_ticks(ax) );
% Draw the plot to generate the undocumented vertex data variable
% and call callback for the first time
drawnow();
回调函数
function change_ticks( ax )
% Modify ruler
ax.XRuler.Axle.VertexData(1,1) = ax.XTick(1);
ax.XRuler.Axle.VertexData(1,2) = ax.XTick(end);
ax.YRuler.Axle.VertexData(2,1) = ax.YTick(1);
ax.YRuler.Axle.VertexData(2,2) = ax.YTick(end);
end
我没有进行详尽的测试,但似乎也适用于自定义刻度。这样可以很好地将标尺截断,不仅在零点处,而且在第一个和最后一个刻度之外。在Windows上测试过Matlab 2019a,ax.XRuler.Axle.VertexData
运行正常。请注意,这仅适用于主要刻度!
axis([minx-minx/10 maxx miny maxy])
或者其他因素而不是1/10。 - shamalaia