在Leaflet中使用markerClusterOptions和SpatialPolygons

4

我正在使用Leaflet包在地图上绘制大约25,000个多边形。由于多边形数量庞大,我想利用markerClusterOptions。

这是我想要做的:

leaflet() %>% 
 addTiles() %>% 
 addPolygons(data=sp_polygons,
            clusterOptions = markerClusterOptions())

但是addPolygons不知道clusterOptions。 可以做的是以下操作:

leaflet() %>% 
 addTiles() %>% 
 addMarkers(data=coordinates(sp_polygons),
            clusterOptions = markerClusterOptions())

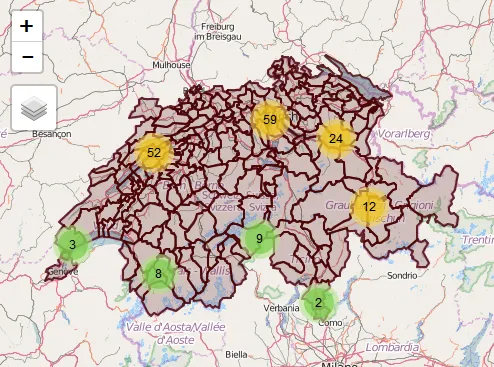
但是当我放大地图时,只能看到标记,而没有多边形。有没有办法在使用clusterOptions的同时,在放大地图时仍然显示多边形?


我认为markerClusterOptions仅适用于addMarkers()或addMarkerCircles()。 - MLavoie
1个回答

2
简而言之,您可以从多边形数据中创建一个SpatialPointsDataFrame(就像您使用coordinates上面所做的那样),然后在同一地图上显示点和多边形。这里是一个使用mapview软件包的示例。
library(sp)
library(mapview)

## create spatial points from Switzerland administrative borders
gadmCHE_pts <- SpatialPointsDataFrame(coordinates(gadmCHE), 
                                      data = gadmCHE@data, 
                                      proj4string = CRS(proj4string(gadmCHE)))

## display data                     
mapview(gadmCHE_pts, clusterOptions = markerClusterOptions()) + 
  gadmCHE

combined_image


网页内容由stack overflow 提供, 点击上面的
可以查看英文原文,
原文链接