我知道这个问题已经在这里提出了:有没有办法增加面板中strip.text栏的高度?
我想减小strip.text栏的高度而不改变文本大小。但是目前情况下,文本和条形图之间始终存在空隙。
这是我迄今为止尝试过的方法,
library(gcookbook) # For the data set
library(ggplot2)
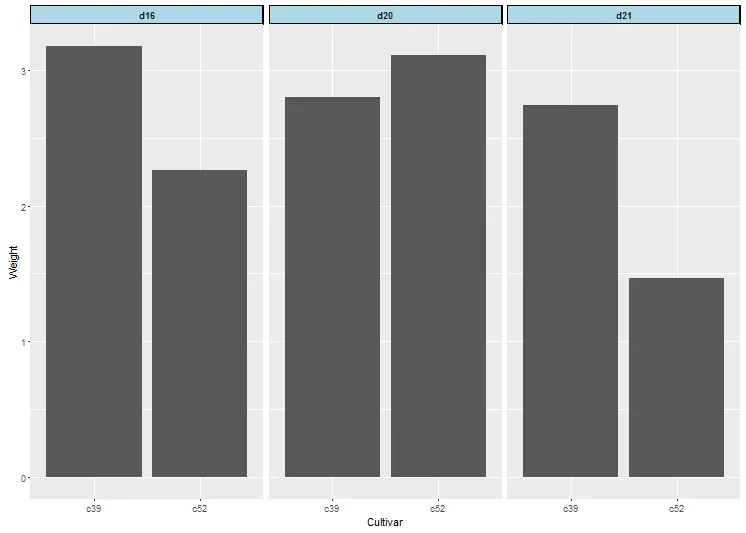
ggplot(cabbage_exp, aes(x=Cultivar, y=Weight)) + geom_bar(stat="identity") +
facet_grid(.~ Date) +
theme(strip.text = element_text(face="bold", size=9,lineheight=5.0),
strip.background = element_rect(fill="lightblue", colour="black",
size=1))
在我的情况下,即使将lineheight更改为5,似乎也不会影响任何内容。为什么?
如何使条形图尺寸稍微变小,但保持文本大小不变?
@Sandy Muspratt回答后编辑
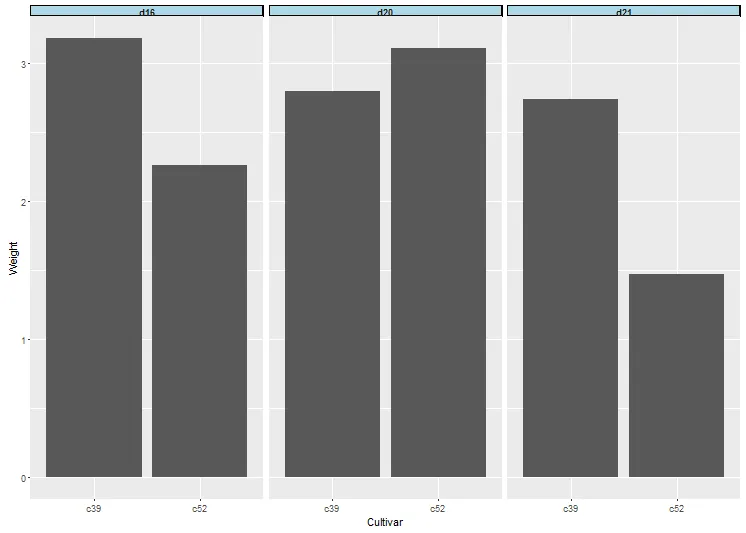
如果只有一行facets,我们可以减小条形图的大小。
g = ggplotGrob(p)
g$heights[c(3)] = unit(.4, "cm")  # Set the height

grid.newpage()
grid.draw(g)
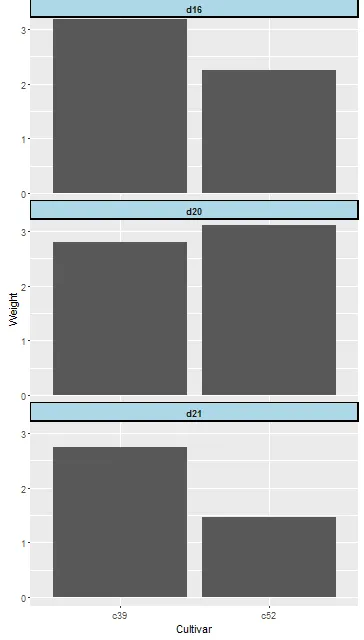
但是,在我的真实数据中,我有许多类似下面的绘图行,并且当我更改g$heights元素时,什么也没发生!
p = ggplot(cabbage_exp, aes(x=Cultivar, y=Weight)) + geom_bar(stat="identity") +
  facet_wrap(~ Date,ncol = 1) +
  theme(strip.text = element_text(face="bold", size=9),
        strip.background = element_rect(fill="lightblue", colour="black",size=1))
 g = ggplotGrob(p)
g$heights
#    [1] 5.5pt               0cm                 0.66882800608828cm  #1null               0cm                 0.193302891933029cm
#     [7] 0.66882800608828cm  1null               0cm                 #0.193302891933029cm 0.66882800608828cm  1null
#    [13] 0.456194824961948cm 0cm                 1grobheight         5.5pt
然后我尝试改变1、7和11元素
g$heights[c(3,7,11)] = unit(.4, "cm")  # Set the height

grid.newpage()
grid.draw(g)
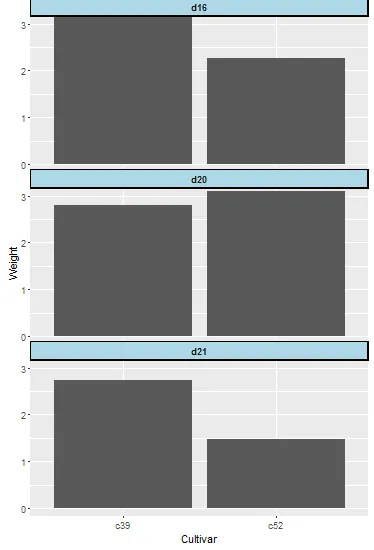
该标签大小没有变化。
> g$heights
 [1] 5.5pt                                                       1grobheight
 [3] sum(0.2cm, sum(0.15cm, 0.8128cm, 0cm, 0.15cm), 0.2cm)+0.2cm 0.2
 [5] 1null                                                       0cm
 [7] 0.193302891933029cm                                         0.2
 [9] 1null                                                       0cm
[11] 0.193302891933029cm                                         0.2
[13] 1null                                                       0cm
[15] 0.193302891933029cm                                         0.2
[17] 1null                                                       0.456194824961948cm
[19] 0cm                                                         1grobheight
[21] 5.5pt
facet_wrap窗口时,那个白色空间变得非常重要。如果我可以控制它的大小,每个窗口的绘图区域就会增加。这就是为什么! - Alexander"\n"。具体操作为:cabbage_exp$Date <- paste0("\n", cabbage_exp$Date, "\n")。 - inscaven