有没有一种好的方法可以使用R中的数据和ReporteRs包来生成完整的Powerpoints呢?
我需要创建大约900个幻灯片。我们的分析师目前按照以下路径进行操作:
DB --> SAS --> CSV --> PPTX(嵌入式图形)(x900次)
这是手动的,容易出错且速度慢。
理想情况下,我更喜欢:
DB --> R + ReporteRs --> PPTX(x1次)
问题有两个。首先,我们的客户(不合理地)更喜欢PPTX而不是网页甚至PDF格式。其次,R图形无法在PPTX中编辑,并且有时大小/格式不理想,特别是在轴文本大小方面。所以,有没有一种方法可以使用R创建可编辑的Powerpoint图形、超链接的目录等呢?如果不能,那么是否至少有一套很好的ggplot2模板可用于良好的PPTX演示格式呢?
2个回答
28
问题已解决。原来是出现了严重的“未阅读手册”情况。解决方法是使用ReporteRs R软件包并阅读手册。 :)
手册:
addPlot {ReporteRs}
addPlot(doc, fun, pointsize = 12, vector.graphic = F, ...)
vector.graphic
logical scalar, if TRUE, vector graphics are produced instead of PNG images.
SVG will be produced for bsdoc objects and DrawingML instructions for docx and
pptx objects.
DrawingML instructions offer advantage to provide editable graphics
(forms and text colors , text     contents, moving and resizing is disabled).
关键段落:使用DrawingML说明为pptx对象绘制图形。DrawingML说明提供可编辑的图形优势。
只需设置vector.graphic=TRUE即可完成设置。
现在我能够在Powerpoint中编辑由R创建的图形:图例、轴标签、所有图形符号。一切。这就像提前过圣诞节!感谢ReporteRs的创建者!现在我可以在3个小时内完成以前需要300个小时才能完成的工作!太惊人了。
下面是完整的实例:
library( ReporteRs )
require( ggplot2 )
mydoc = pptx( )
mydoc = addSlide( mydoc, slide.layout = "Title and Content" )
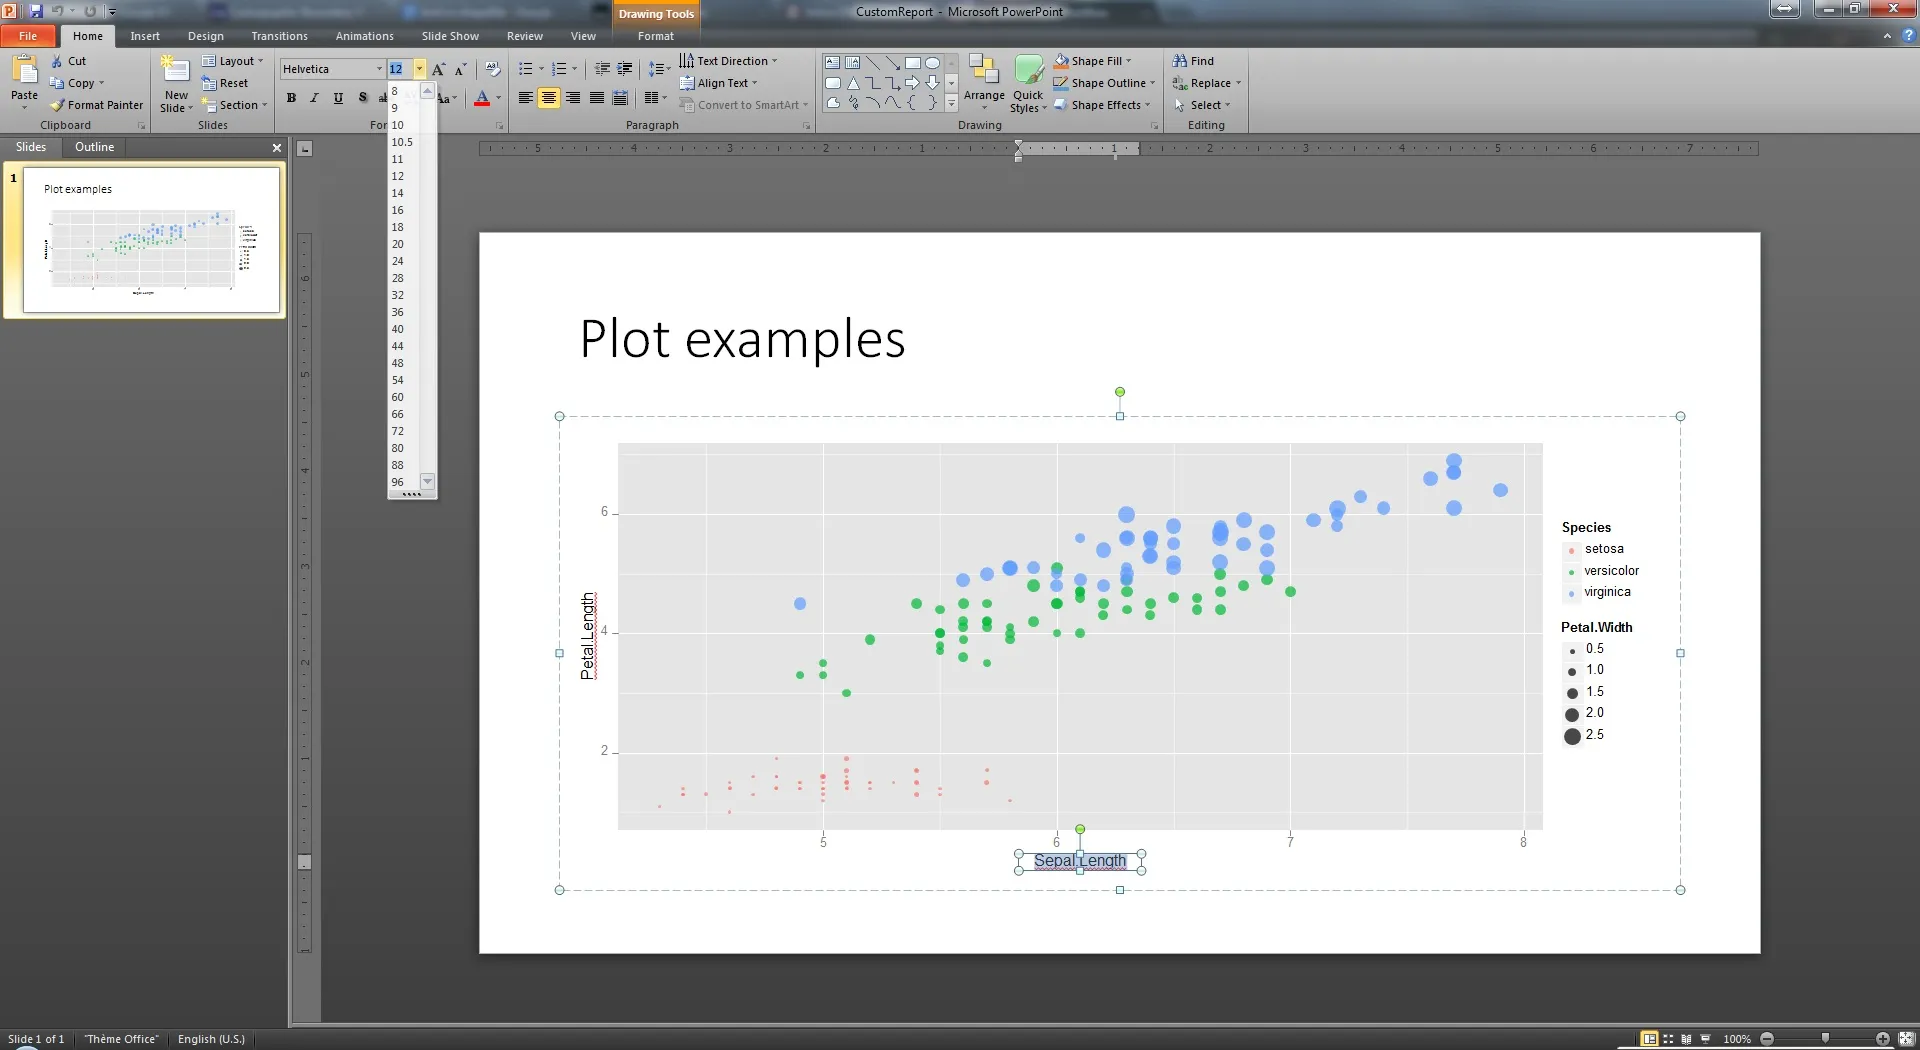
mydoc = addTitle( mydoc, "Plot examples" )
myplot = qplot(Sepal.Length, Petal.Length
, data = iris, color = Species
, size = Petal.Width, alpha = I(0.7)
)
# Add titles and then 'myplot'
mydoc = addPlot( mydoc, function( ) print( myplot ), vector.graphic=TRUE)
writeDoc( mydoc, file = "~/CustomReport.pptx" )
结果:
- Serban Tanasa
6
点赞以示演示。由于我的工作区中有非标准的
iris版本,因此我花了一些时间进行调试,但我成功地让Mac版本的R编写了一个可读取的.pptx文件。该格式是SVG,由grDevices包的'cairo'页面上描述的svg()函数编写。 - IRTFM我无法在ReporteRs中找到任何选项来创建动画/过渡/效果。它似乎只能创建静态内容。 - skan
1也许我没有用正确的词语。您如何创建一个类似上面的幻灯片,但是每次按下按钮时,点(蓝色和绿色)都会逐个出现? - skan
1@ Skan:在将 ggplot2 对象从 R 导出到 *.pptx 后,您可以在 PowerPoint 中手动完成此操作,就像 Serban 描述的那样。导出的图像是完全可编辑的。 - Matthias
1ReporteRs软件包现已弃用,已被officer取代。我刚刚创建了一个实用程序包export,可以轻松将大量的R图形导出到Powerpoint中,它刚刚在CRAN上发布 - 请参见https://cran.r-project.org/web/packages/export/index.html和https://github.com/tomwenseleers/export。 - Tom Wenseleers
2
您可以使用我刚刚发布在CRAN上的新
例如:
export软件包,轻松导出到Office(Word / Powerpoint)本地Office矢量格式,从而得到完全可编辑的图形,请参见https://cran.r-project.org/web/packages/export/index.html和https://github.com/tomwenseleers/export。例如:
install.packages("export")
library(export)

?graph2ppt
?graph2doc

library(ggplot2)
qplot(Sepal.Length, Petal.Length, data = iris, color = Species,
      size = Petal.Width, alpha = I(0.7))
graph2ppt(file="ggplot2_plot.pptx", width=7, height=5)
graph2doc(file="ggplot2_plot.docx", width=7, height=5)
- Tom Wenseleers
网页内容由stack overflow 提供, 点击上面的可以查看英文原文,
原文链接
原文链接
setEPS()和postscript()文档以获取创建.eps文件的方法,这些文件被PPT接受,可以进行矢量映射,并且至少在它们的“白色”区域是透明的。我刚刚测试了在Mac上使用透明度的rgb颜色的能力。 - IRTFM