我希望能够对表格的一列进行格式化,但是在迭代行时,每次迭代后,该列的宽度似乎都会发生变化。
源代码
def p_create_table(self, events, dates, rows, columns, portfolio):
    """
    :param events: Dict - {Date:Event} where Event is a String identifying
    what event happened
    :param dates: List - Dates of events
    :param rows: Int - number of Dates (rows) to create for the table
    :param columns: List - Column headers
    :param portfolio: Dataframe - Portfolio with calculated totals and returns
    :return:
    """
    cell_text = self.p_create_cell_text(events, dates, portfolio)
    cell_text.pop(0)
    row_labels = self.p_create_row_labels(rows)
    row_labels.pop(len(row_labels) - 1)
    colors = self.p_set_table_colors(row_labels)

    table = plt.table(cellText=cell_text, cellColours=colors[0],
              rowColours=colors[1], rowLabels=row_labels,
              colColours=colors[2], colLabels=columns,
              bbox=[0.0, -1.3, 1.0, 1.0], cellLoc='center')

    table.auto_set_font_size(False)
    table.set_fontsize(9)
    table.scale(2, 2)

    cell_dict = table.get_celld()
    for i in range(13):
        cell_dict[(i,1)].set_width(0.3)
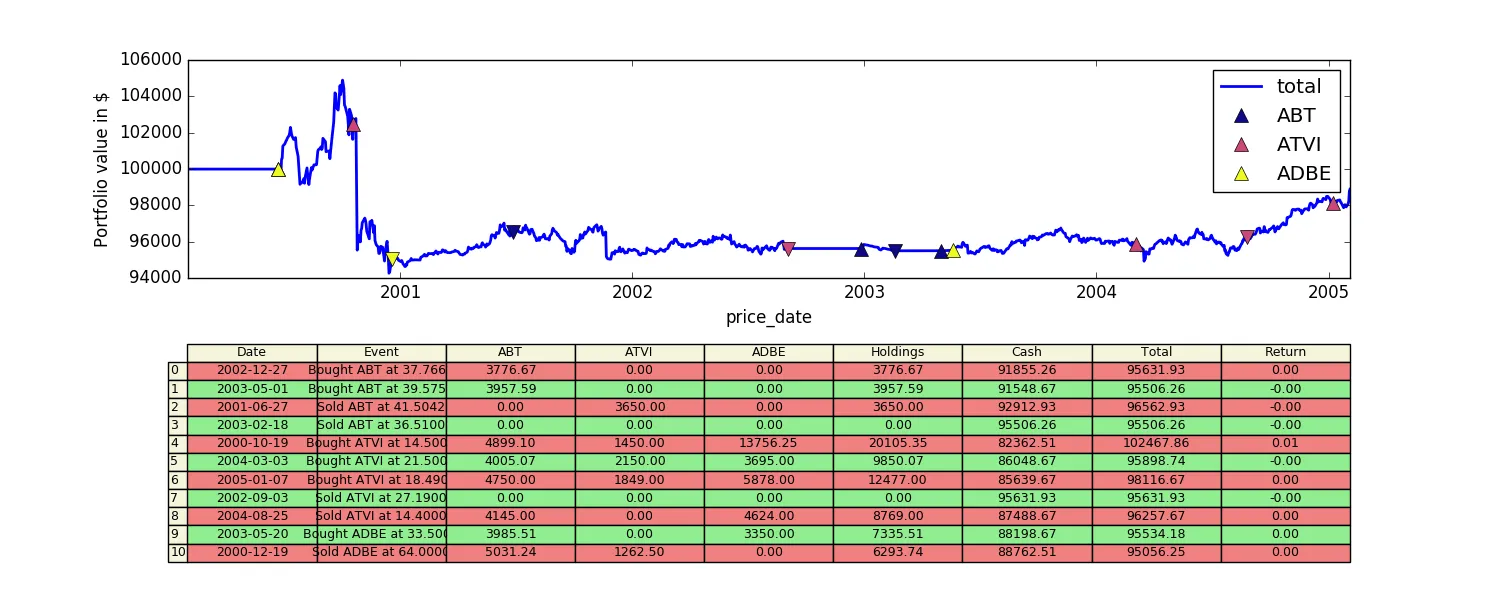
以下是调整大小之前的表格图像。该快照是在执行
table.set_fontsize(9) 后拍摄的。我想调整第二列 Event 的大小。
格式化之前
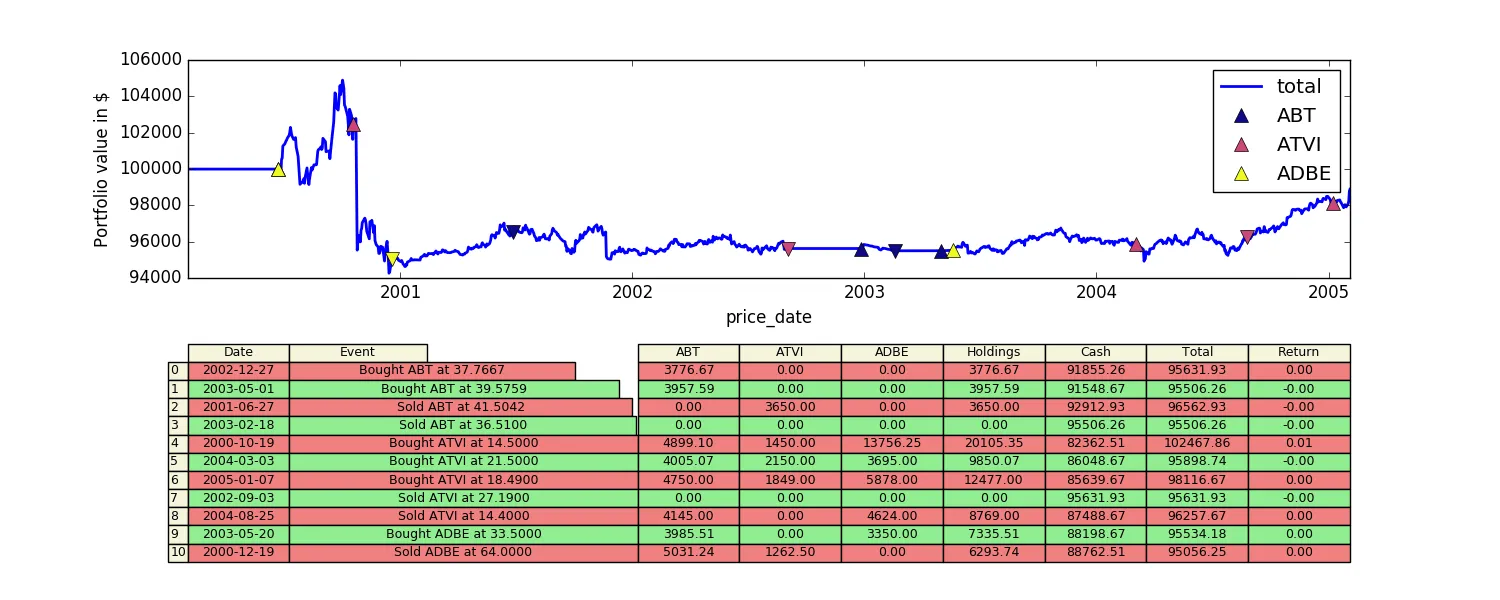
不幸的是,在每次迭代后:
for i in range(13):
    cell_dict[(i,1)].set_width(0.3)
看起来单元格宽度增加了,导致出现了这样的情况:
格式化之后
对于为什么会发生这种情况,或者调整宽度的其他解决方案,欢迎提出建议!
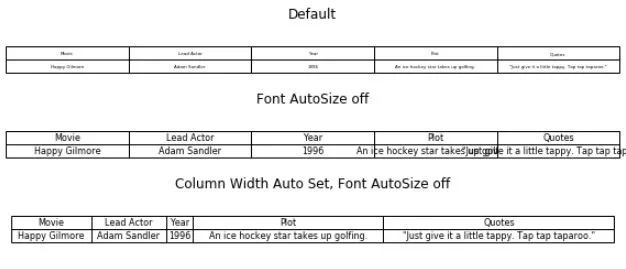
tab2.auto_set_column_width(col=list(range(len(dff.columns))))- 这是使第三个表格与第二个不同的那一行。 - Sam Jett