用MATLAB中的感知器对数据进行分类

4
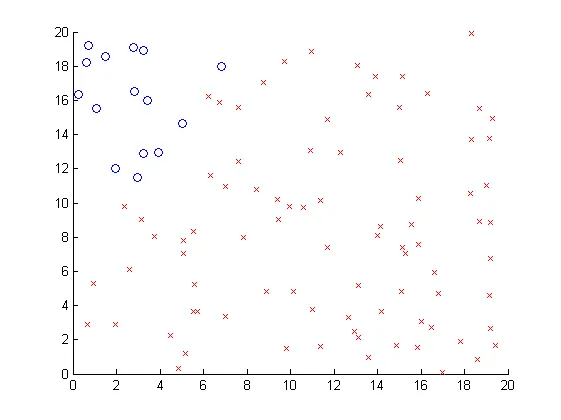
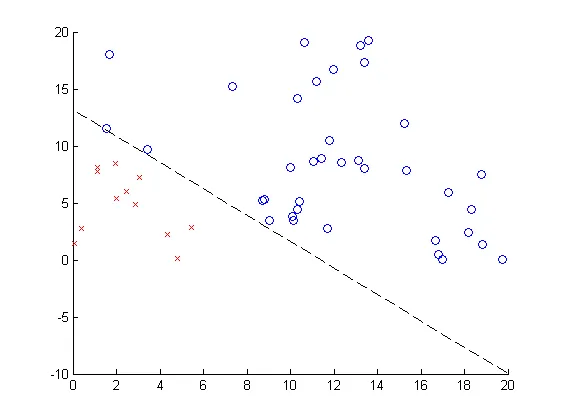
我正在生成可线性分离的随机数据。我想编写自己的感知器版本来进行分离。我知道有些帖子存在类似的问题,但我找不到我的错误。我真的被卡住了。算法运行了,但似乎无法收敛。如果你能帮助我,我将不胜感激。
我的代码:
single_layer_perceptron.m
% INPUT
% amount of values
points = 20;
% stepsize
s = 1.0;

% INITIALIZE
% Booleans
TRUE  = 1;
FALSE = 0;

% generate data
D = generateRandomData(points);
% x-values
x = D(:,1);
% y-values
y = D(:,2);
% training set
d = D(:,3);
% weights
w = zeros(3,1);
% bias
b = 1;
% sucsess flag
isCorrect = FALSE;
% correctly predicted values counter
p = 0;
% COMPUTE 

% while at east one point is not correctly classified
while isCorrect == FALSE
    % for every point in the dataset
    for i=1 : points
        % calculate outcome with current weight
        c = heaviside(b * w(1) + x(i) * w(2) + y(i) * w(3));
        % compare output with training set
        a = errorFunction(c,d(i)); 
        % if outcome was wrong
        if a ~= 0
            % ajust weights
            w(1) = w(1) + a*s*b;
            w(2) = w(2) + a*s*x(i);
            w(3) = w(3) + a*s*y(i);
        else
            % increase correctness counter
            p = p + 1;
        end
    end

    %disp(w);
    disp(p);

    if p >= points
       isCorrect = TRUE;
    end

    p = 0;

end

generateRandomData.m

function f = generateRandomData(points)
% generates random data that can be lineary seperated (silent)
% generate random function y = mx + n
m = 2  * rand * sign(randn);   % in (-2,2)/0
n = 10  * rand + 5;            % in (5,15)

% generate random points
x = 20 * rand(points,2);        % in ((0,20), (0,20))

% labeling
f = [x, zeros(points,1)];
for i=1:length(x(:,1))
    y = m*x(i,1) + n;
    if x(i,2) > y
        f(i,3) = 1;
    end    
end

end

activationFunctionHeaviside.m

function f = activationFunctionHeaviside(x)
f = (1/2)*(sign(x)+1);
end

errorFunction.m

function f = errorFunction(c,d)
% w has been classified as c - w should be d

if c < d 
    % reaction too small 
    f = -1;
elseif c > d
    % reaction too large
    f = 1;
else
    % reaction correct
    f = 0;
end

end

非常感谢您!

变量“points”确切表示什么?好的,我在你的注释行中看到了值的数量...那是什么?例如,我正在使用Fisher鸢尾花数据集;在这种情况下,我可以用什么来替换“points”? - Jimbo_ai
1个回答

6
单层感知器 是一个线性的二元分类器,当数据不是线性可分时无法收敛。如果我们将数据绘制出来,会发现两个类别重叠。

enter image description here

我们可以通过在函数generateRandomData.m中添加公差来解决这个问题。

function f = generateRandomData(points)
% generates random data that can be lineary seperated (silent)
% generate random function y = mx + n
m = 2  * rand * sign(randn);   % in (-2,2)/0
n = 10  * rand + 5;            % in (5,15)

% generate random points
x = 20 * rand(points,2);        % in ((0,20), (0,20))

% tolerance
tol = 0.5;

% labeling
f = [x, -ones(points,1)];
for ii=1:size(f,1)
    y = m*f(ii,1) + n;
    if f(ii,2) > y+tol
        f(ii,3) = 1;
    elseif f(ii,2) < y-tol
        f(ii,3) = 0;
    else
        f(ii,1) = f(ii,1)+2*tol;
        f(ii,3) = 1;
    end    
end
end

然而,由于您的 errorFunction.m 的符号已经更改,您的代码仍然无法收敛。它应该像这样:
function f = errorFunction(c,d)
% w has been classified as c - w should be d

if c < d 
    % reaction too small 
    f = +1;
elseif c > d
    % reaction too large
    f = -1;
else
    % reaction correct
    f = 0;
end

end

一旦我们进行这些更改,我们会得到一个漂亮的线性分类:

enter image description here

绘制假设的代码:

% Plot
idx = logical(D(:,3));
Xax = 0:20; Yax=-(b*w(1)+Xax*w(2))/w(3);
figure;
hold on;
scatter(D(idx,1),D(idx,2),'bo')
scatter(D(~idx,1),D(~idx,2),'rx')
plot(Xax,Yax,'k--')

很高兴它能帮到你。如果这个解决方案解决了你的问题,请不要忘记将其标记为有效答案,以帮助其他用户。 - tashuhka
还有一个问题:您是如何画出这条线的? 我尝试过: xValues = linspace(0,20,10); yValues = (-1 * ( xValues* w(1) + b * w(3) )) / w(2); - Chris
@Chris,公差是做什么用的? - user366312
公差仅用于生成训练数据。它确保标签在特征空间中是线性可分的。 - tashuhka
@tashuhka,这是一个二元在线感知器,对吗? - user366312
它是一个二元分类器,因为只有两个类别,这对感知器来说总是如此。感知器的学习算法可以是在线和离线的。在这种情况下,它是离线的,因为训练样本被多次使用直到收敛。 - tashuhka

网页内容由stack overflow 提供, 点击上面的
可以查看英文原文,
原文链接