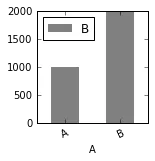
给定以下条形图:
import numpy as np
import matplotlib.pyplot as plt
import pandas as pd

df = pd.DataFrame({'A': ['A', 'B'], 'B': [1000,2000]})

fig, ax = plt.subplots(1, 1, figsize=(2, 2))

df.plot(kind='bar', x='A', y='B',
        align='center', width=.5, edgecolor='none',
        color='grey', ax=ax)
plt.xticks(rotation=25)
plt.show()
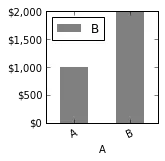
我知道可以使用以下代码添加美元符号:
import matplotlib.ticker as mtick
fmt = '$%.0f'
tick = mtick.FormatStrFormatter(fmt)
ax.yaxis.set_major_formatter(tick)
...并在此处添加逗号:
ax.get_yaxis().set_major_formatter(
     mtick.FuncFormatter(lambda x, p: format(int(x), ',')))
...但是我怎么同时得到两个呢?
StrMethodFormatter和FormatStrFormatter。 - Boris Yakubchikcurrency = lambda x, pos: "${x:,.0f}k".format(x * 1e-3),并将该函数传递给格式化程序ax.yaxis.set_major_formatter(currency)。 - igorkf