我一直都喜欢完整的例子,这样其他人可以复制它们而不需要猜测Excel表格可能会是什么样子。
以下完整示例创建了一个包含一些示例数据和折线图的新的Office Open XML格式(*.xlsx)Excel工作簿。
第一部分代码创建了一个折线图,演示了apache poi版本3.17默认创建的方式。
然后在第二部分代码中,我对图表进行了自定义设置。代码部分有注释说明其功能。在此之后,自定义的图表也与OpenOffice/Libreoffice Calc兼容。但是apache poi默认的图表不与OpenOffice/Libreoffice Calc兼容。至少在版本3.17之前是这样。
要进行自定义设置,需要了解apache poi使用作为基本对象的内部低级对象。这些对象包含在ooxml-schemas-1.3.jar中。不幸的是,没有API文档公开可用。因此,必须下载ooxml-schemas-1.3-sources.jar,然后自己进行javadoc以获取文档。
此外,应该知道Office Open XML格式(*.xlsx)的文件只是ZIP归档文件。因此,可以解压它们并查看/xl/charts/chart1.xml。当apache poi创建图表后,进行这样的操作并将其与在Excel中完成所需更改后重新保存的XML进行比较,然后就可以看到所需的XML更改。
示例:
import java.io.FileOutputStream;
import org.apache.poi.ss.usermodel.*;
import org.apache.poi.ss.usermodel.charts.*;
import org.apache.poi.xssf.usermodel.*;
import org.apache.poi.ss.util.CellRangeAddress;
import org.apache.poi.util.Units;
public class CreateExcelLineChartAndCustomize {
public static void main(String[] args) throws Exception {
Workbook wb = new XSSFWorkbook();
Sheet sheet = wb.createSheet("linechart");
final int NUM_OF_ROWS = 100;
final int NUM_OF_COLUMNS = 5;
Row row;
Cell cell;
String[] headings = new String []{"x", "sin(x)", "cos(x)", "random", "random/x"};
for (int rowIndex = 0; rowIndex < 1; rowIndex++) {
row = sheet.createRow(rowIndex);
for (int colIndex = 0; colIndex < NUM_OF_COLUMNS; colIndex++) {
cell = row.createCell(colIndex);
cell.setCellValue(headings[colIndex]);
}
}
for (int rowIndex = 1; rowIndex < NUM_OF_ROWS; rowIndex++) {
row = sheet.createRow(rowIndex);
for (int colIndex = 0; colIndex < NUM_OF_COLUMNS; colIndex++) {
cell = row.createCell(colIndex);
switch (colIndex) {
case 0:
cell.setCellValue(rowIndex/10d);
break;
case 1:
cell.setCellFormula("SIN(A" + (rowIndex+1) + ")");
break;
case 2:
cell.setCellFormula("COS(A" + (rowIndex+1) + ")");
break;
case 3:
cell.setCellFormula("RAND()");
break;
case 4:
cell.setCellFormula("-D"+(rowIndex+1));
break;
default:
}
}
}
Drawing<?> drawing = sheet.createDrawingPatriarch();
ClientAnchor anchor = drawing.createAnchor(0, 0, 0, 0, 6, 1, 15, 21);
Chart chart = drawing.createChart(anchor);
ChartLegend legend = chart.getOrCreateLegend();
legend.setPosition(LegendPosition.RIGHT);
if (chart instanceof XSSFChart) ((XSSFChart)chart).setTitleText("Some lines");
LineChartData data = chart.getChartDataFactory().createLineChartData();
ChartAxis bottomAxis = chart.getChartAxisFactory().createCategoryAxis(AxisPosition.BOTTOM);
ValueAxis leftAxis = chart.getChartAxisFactory().createValueAxis(AxisPosition.LEFT);
leftAxis.setCrosses(AxisCrosses.AUTO_ZERO);
ChartDataSource<Number> xs = DataSources.fromNumericCellRange(sheet, new CellRangeAddress(1, 99, 0, 0));
ChartDataSource<Number> ys1 = DataSources.fromNumericCellRange(sheet, new CellRangeAddress(1, 99, 1, 1));
ChartDataSource<Number> ys2 = DataSources.fromNumericCellRange(sheet, new CellRangeAddress(1, 99, 2, 2));
ChartDataSource<Number> ys3 = DataSources.fromNumericCellRange(sheet, new CellRangeAddress(1, 99, 3, 3));
ChartDataSource<Number> ys4 = DataSources.fromNumericCellRange(sheet, new CellRangeAddress(1, 99, 4, 4));
LineChartSeries series1 = data.addSeries(xs, ys1);
series1.setTitle("Value 1");
LineChartSeries series2 = data.addSeries(xs, ys2);
series2.setTitle("Value 2");
LineChartSeries series3 = data.addSeries(xs, ys3);
series3.setTitle("Value 3");
LineChartSeries series4 = data.addSeries(xs, ys4);
series4.setTitle("Value 4");
chart.plot(data, bottomAxis, leftAxis);
if (chart instanceof XSSFChart) {
XSSFChart xssfChart = (XSSFChart)chart;
if (xssfChart.getCTChart().getAutoTitleDeleted() == null) xssfChart.getCTChart().addNewAutoTitleDeleted();
xssfChart.getCTChart().getAutoTitleDeleted().setVal(false);
if (xssfChart.getCTChartSpace().getSpPr() == null) xssfChart.getCTChartSpace().addNewSpPr();
if (xssfChart.getCTChartSpace().getSpPr().getSolidFill() == null)
xssfChart.getCTChartSpace().getSpPr().addNewSolidFill();
if (xssfChart.getCTChartSpace().getSpPr().getSolidFill().getSrgbClr() == null)
xssfChart.getCTChartSpace().getSpPr().getSolidFill().addNewSrgbClr();
xssfChart.getCTChartSpace().getSpPr().getSolidFill().getSrgbClr().setVal(new byte[]{(byte)255,(byte)255,(byte)255});
if (xssfChart.getCTChartSpace().getSpPr().getLn() == null) xssfChart.getCTChartSpace().getSpPr().addNewLn();
xssfChart.getCTChartSpace().getSpPr().getLn().setW(Units.pixelToEMU(1));
if (xssfChart.getCTChartSpace().getSpPr().getLn().getSolidFill() == null)
xssfChart.getCTChartSpace().getSpPr().getLn().addNewSolidFill();
if (xssfChart.getCTChartSpace().getSpPr().getLn().getSolidFill().getSrgbClr() == null)
xssfChart.getCTChartSpace().getSpPr().getLn().getSolidFill().addNewSrgbClr();
xssfChart.getCTChartSpace().getSpPr().getLn().getSolidFill().getSrgbClr().setVal(new byte[]{(byte)0,(byte)0,(byte)0});
if (xssfChart.getCTChart().getPlotArea().getCatAxArray(0).getSpPr() == null)
xssfChart.getCTChart().getPlotArea().getCatAxArray(0).addNewSpPr();
if (xssfChart.getCTChart().getPlotArea().getCatAxArray(0).getSpPr().getLn() == null)
xssfChart.getCTChart().getPlotArea().getCatAxArray(0).getSpPr().addNewLn();
xssfChart.getCTChart().getPlotArea().getCatAxArray(0).getSpPr().getLn().setW(Units.pixelToEMU(1));
if (xssfChart.getCTChart().getPlotArea().getCatAxArray(0).getSpPr().getLn().getSolidFill() == null)
xssfChart.getCTChart().getPlotArea().getCatAxArray(0).getSpPr().getLn().addNewSolidFill();
if (xssfChart.getCTChart().getPlotArea().getCatAxArray(0).getSpPr().getLn().getSolidFill().getSrgbClr() == null)
xssfChart.getCTChart().getPlotArea().getCatAxArray(0).getSpPr().getLn().getSolidFill().addNewSrgbClr();
xssfChart.getCTChart().getPlotArea().getCatAxArray(0).getSpPr().getLn().getSolidFill().getSrgbClr()
.setVal(new byte[]{(byte)0,(byte)0,(byte)0});
if (xssfChart.getCTChart().getPlotArea().getValAxArray(0).getSpPr() == null)
xssfChart.getCTChart().getPlotArea().getValAxArray(0).addNewSpPr();
if (xssfChart.getCTChart().getPlotArea().getValAxArray(0).getSpPr().getLn() == null)
xssfChart.getCTChart().getPlotArea().getValAxArray(0).getSpPr().addNewLn();
xssfChart.getCTChart().getPlotArea().getValAxArray(0).getSpPr().getLn().setW(Units.pixelToEMU(1));
if (xssfChart.getCTChart().getPlotArea().getValAxArray(0).getSpPr().getLn().getSolidFill() == null)
xssfChart.getCTChart().getPlotArea().getValAxArray(0).getSpPr().getLn().addNewSolidFill();
if (xssfChart.getCTChart().getPlotArea().getValAxArray(0).getSpPr().getLn().getSolidFill().getSrgbClr() == null)
xssfChart.getCTChart().getPlotArea().getValAxArray(0).getSpPr().getLn().getSolidFill().addNewSrgbClr();
xssfChart.getCTChart().getPlotArea().getValAxArray(0).getSpPr().getLn().getSolidFill().getSrgbClr()
.setVal(new byte[]{(byte)0,(byte)0,(byte)0});
for (int i = 0; i < 4; i++) {
if (xssfChart.getCTChart().getPlotArea().getLineChartArray(0).getSerArray(i).getSpPr() == null)
xssfChart.getCTChart().getPlotArea().getLineChartArray(0).getSerArray(i).addNewSpPr();
if (xssfChart.getCTChart().getPlotArea().getLineChartArray(0).getSerArray(i).getSpPr().getLn() == null)
xssfChart.getCTChart().getPlotArea().getLineChartArray(0).getSerArray(i).getSpPr().addNewLn();
xssfChart.getCTChart().getPlotArea().getLineChartArray(0).getSerArray(i)
.getSpPr().getLn().setW(Units.pixelToEMU(3));
if (xssfChart.getCTChart().getPlotArea().getLineChartArray(0).getSerArray(i).getSpPr().getLn().getSolidFill() == null)
xssfChart.getCTChart().getPlotArea().getLineChartArray(0).getSerArray(i).getSpPr().getLn().addNewSolidFill();
if (xssfChart.getCTChart().getPlotArea().getLineChartArray(0).getSerArray(i).getSpPr().getLn().getSolidFill().getSrgbClr() == null)
xssfChart.getCTChart().getPlotArea().getLineChartArray(0).getSerArray(i).getSpPr().getLn().getSolidFill().addNewSrgbClr();
}
xssfChart.getCTChart().getPlotArea().getLineChartArray(0).getSerArray(0)
.getSpPr().getLn().getSolidFill().getSrgbClr().setVal(new byte[]{(byte)255,(byte)0,(byte)0});
xssfChart.getCTChart().getPlotArea().getLineChartArray(0).getSerArray(1)
.getSpPr().getLn().getSolidFill().getSrgbClr().setVal(new byte[]{(byte)0,(byte)255,(byte)0});
xssfChart.getCTChart().getPlotArea().getLineChartArray(0).getSerArray(2)
.getSpPr().getLn().getSolidFill().getSrgbClr().setVal(new byte[]{(byte)0,(byte)0,(byte)255});
xssfChart.getCTChart().getPlotArea().getLineChartArray(0).getSerArray(3)
.getSpPr().getLn().getSolidFill().getSrgbClr().setVal(new byte[]{(byte)255,(byte)255,(byte)0});
for (int i = 0; i < 4; i++) {
if (xssfChart.getCTChart().getPlotArea().getLineChartArray(0).getSerArray(i).getSmooth() == null)
xssfChart.getCTChart().getPlotArea().getLineChartArray(0).getSerArray(i).addNewSmooth();
xssfChart.getCTChart().getPlotArea().getLineChartArray(0).getSerArray(i).getSmooth().setVal(false);
}
for (int i = 0; i < 4; i++) {
if (xssfChart.getCTChart().getPlotArea().getLineChartArray(0).getSerArray(i).getMarker() == null)
xssfChart.getCTChart().getPlotArea().getLineChartArray(0).getSerArray(i).addNewMarker();
if (xssfChart.getCTChart().getPlotArea().getLineChartArray(0).getSerArray(i).getMarker().getSymbol() == null)
xssfChart.getCTChart().getPlotArea().getLineChartArray(0).getSerArray(i).getMarker().addNewSymbol();
}
xssfChart.getCTChart().getPlotArea().getLineChartArray(0).getSerArray(0).getMarker().getSymbol().setVal(
org.openxmlformats.schemas.drawingml.x2006.chart.STMarkerStyle.NONE);
xssfChart.getCTChart().getPlotArea().getLineChartArray(0).getSerArray(1).getMarker().getSymbol().setVal(
org.openxmlformats.schemas.drawingml.x2006.chart.STMarkerStyle.DIAMOND);
xssfChart.getCTChart().getPlotArea().getLineChartArray(0).getSerArray(2).getMarker().unsetSymbol();
xssfChart.getCTChart().getPlotArea().getLineChartArray(0).getSerArray(3).getMarker().getSymbol().setVal(
org.openxmlformats.schemas.drawingml.x2006.chart.STMarkerStyle.NONE);
}
wb.write(new FileOutputStream("CreateExcelLineChartAndCustomize.xlsx"));
wb.close();
}
}
结果:
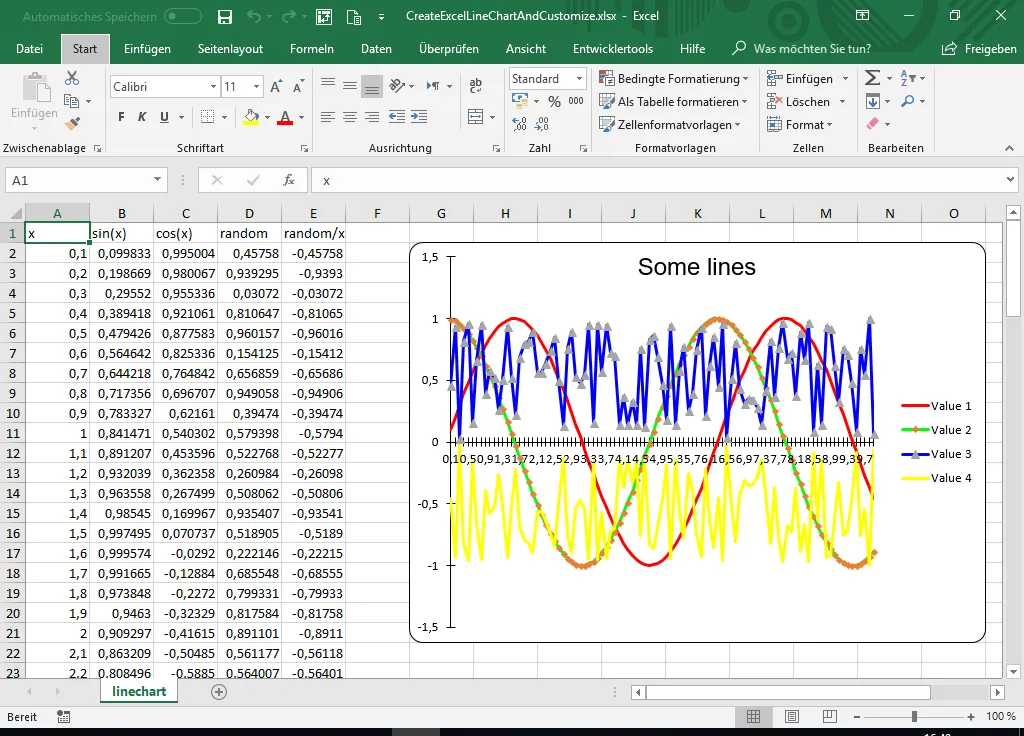
这是一个展示图片的HTML代码。