我有一些人口统计数据,想用它来制作美国县份的等值线地图。我的工作流程没有出现任何错误,我能够创建最终地图,但是它所映射的数据是不正确的。我的工作流程使用了两个数据源——一个形状文件和一个数据框架。这个形状文件是一个县份形状文件,可以在这个链接https://www.dropbox.com/s/4ujxidyx42793j7/cb_2015_us_county_500k.zip?dl=1找到。
数据框架文件可以在这个链接https://www.dropbox.com/s/qys6s6ikrs1g2xb/data.dem.csv?dl=1找到。
输出结果应如下所示: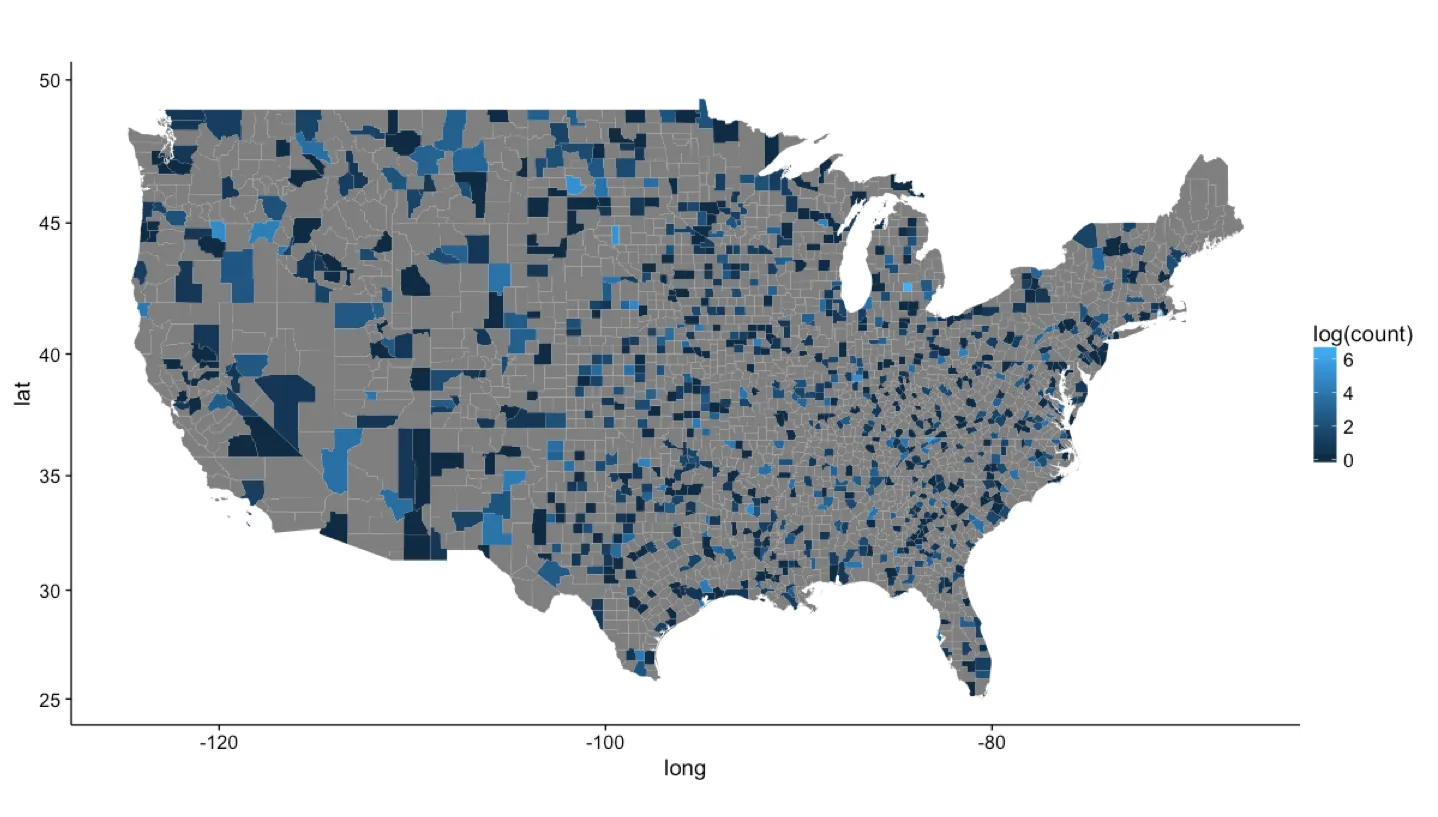 但这是错误的,有很多原因可以看出来。首先,显而易见的是大部分数据没有被映射。地图上的灰色区域表示NA。但我在上面的步骤中删除了NAs,而且在检查用于映射(map.plot)的数据时,填充变量(计数)中没有NAs。其次,映射值的分布不正确。洛杉矶县的计数值应该是793(对数值为6.675823),然而在地图上,许多颜色较浅的县表明其他空间单位的值更高,而一些排名前几位的县,如圣迭戈,根本没有被填充(地图的左下角)。
当我检查用于绘制地图(map.plot)的数据时,一切似乎都很好。洛杉矶县仍然是“count”变量最高价值的县,但地图表明情况并非如此(请参见此处的图像)。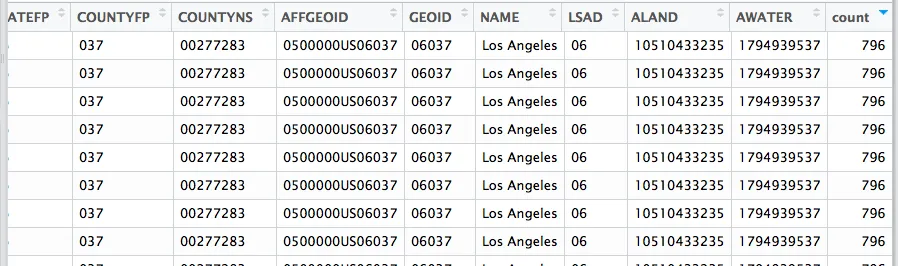 我希望有人能在这里进行一些取证,并确定问题所在。我已经尽力检查了所有步骤,但似乎无法确定问题。提前致谢。
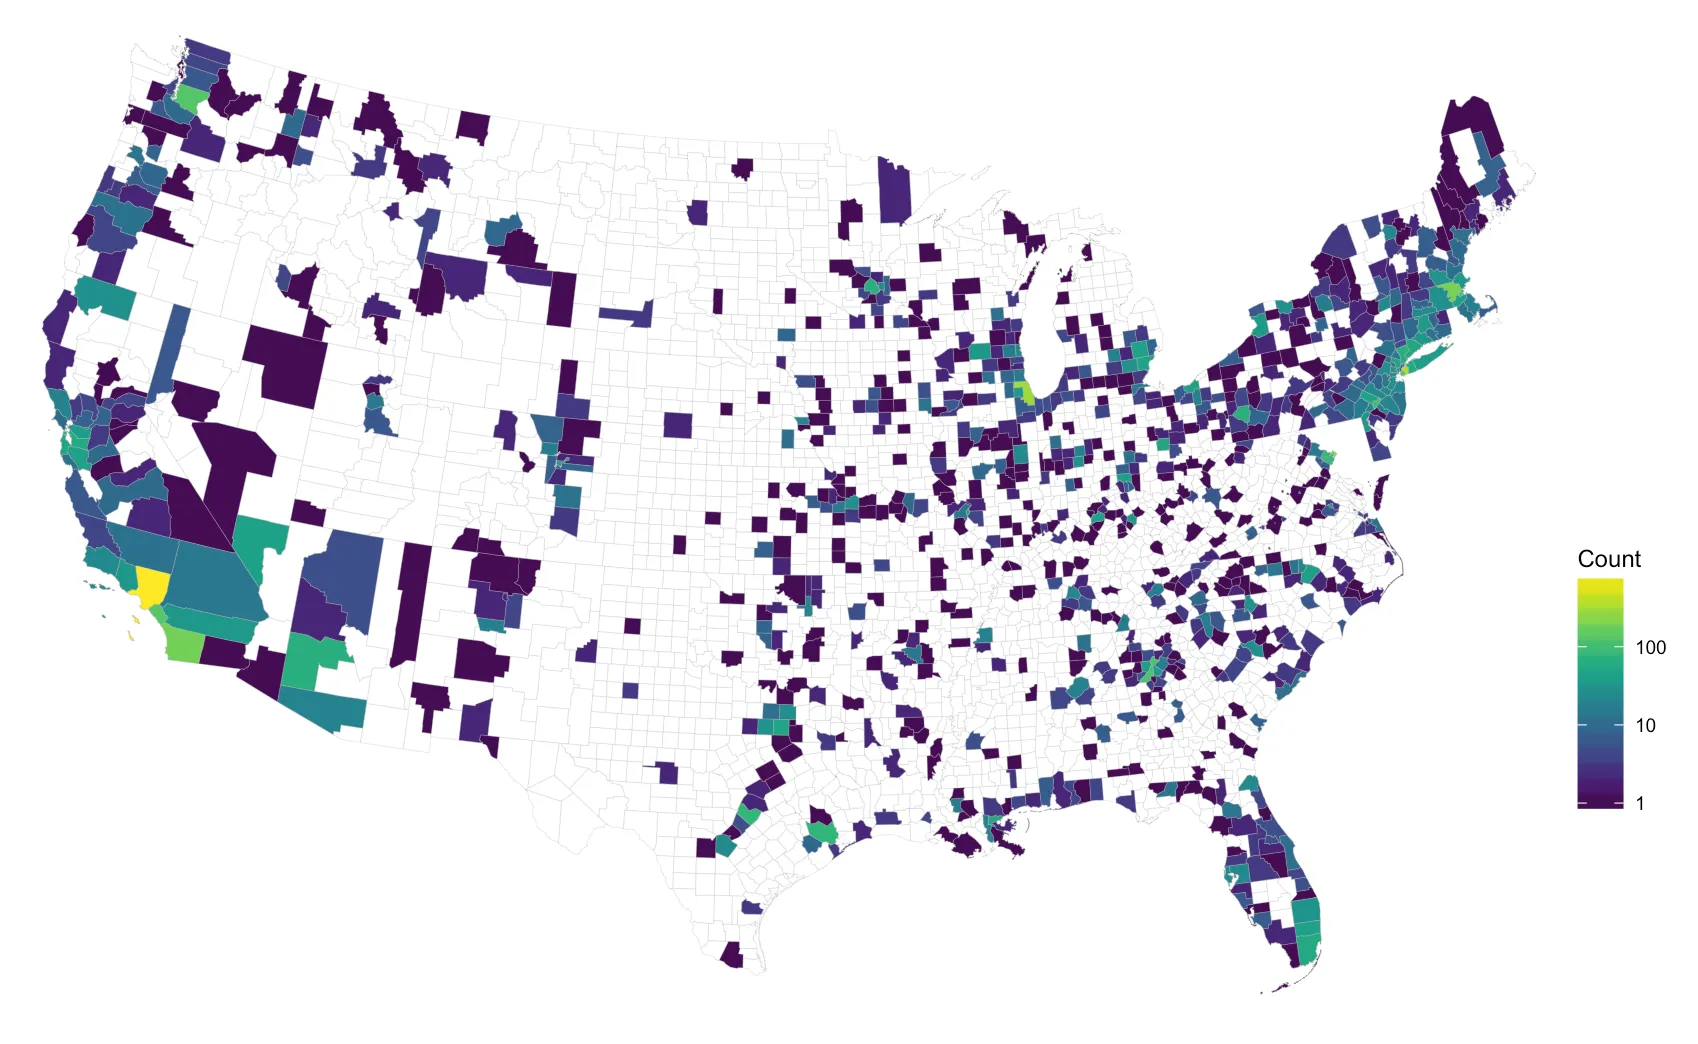
更新:我尝试使用来自同一来源的不同shapefile。上面链接中的shapefile与以下网址(https://www.census.gov/geo/maps-data/data/cbf/cbf_counties.html)标记为“cb_2015_us_county_500k.zip”的文件相同。当我选择不同的shapefile(例如cb_2015_us_county_5m.zip)时,我得到了一个不同的地图,但是出现了相同的问题:请参见以下地图作为例子:
以下是我的代码:
#Load dependencies
library(sp)
library(spatialEco)
library(rgdal)
library(dplyr)
library(maptools)
library(taRifx.geo)
library(ggplot2)
library(USAboundaries)
library(splitstackshape)
library(maps)
library(cowplot)

#Read in shape and csv files
county.track<-readOGR("/path", "filename")
county.track@data$id = rownames(county.track@data)
data<-read.csv("/path/filename.csv")

#Convert data.frame (data) to points polygon file
data$y<-data$lat
data$x<-data$long
coordinates(data) <- ~ x + y
proj4string(data) <- CRS("+proj=longlat +datum=WGS84 +no_defs +ellps=WGS84 +towgs84=0,0,0")
proj4string(county.track) <- CRS("+proj=longlat +datum=WGS84 +no_defs +ellps=WGS84 +towgs84=0,0,0")

#Overlay points onto polygons
county.track.data<-point.in.poly(data, county.track)

#Summarize point data by county
count<-select(as.data.frame(county.track.data), id, count)
count<-count %>%
  group_by(id) %>%
  summarize(count=sum(count))

#Merge with shape file data
county.track@data<-merge(county.track@data, count, by="id", all.x=T)

#Replace NA values with zeroes
county.track@data$count[is.na(county.track@data$count)]<-0
county.track.points = fortify(county.track, region="id")
map.plot<-merge(county.track.points, county.track@data, by="id")

#Get rid of Hawaii and Alaska
map.plot<-map.plot %>%
  filter(lat<50 & lat>25) %>%
  filter(long>-130)

#Create choropleth map using ggplot2
 ggplot(map.plot) +
  geom_polygon(aes(long, lat, group=group, fill=log(count))) +
  coord_map()
输出结果应如下所示:
但这是错误的,有很多原因可以看出来。首先,显而易见的是大部分数据没有被映射。地图上的灰色区域表示NA。但我在上面的步骤中删除了NAs,而且在检查用于映射(map.plot)的数据时,填充变量(计数)中没有NAs。其次,映射值的分布不正确。洛杉矶县的计数值应该是793(对数值为6.675823),然而在地图上,许多颜色较浅的县表明其他空间单位的值更高,而一些排名前几位的县,如圣迭戈,根本没有被填充(地图的左下角)。当我检查用于绘制地图(map.plot)的数据时,一切似乎都很好。洛杉矶县仍然是“count”变量最高价值的县,但地图表明情况并非如此(请参见此处的图像)。
我希望有人能在这里进行一些取证,并确定问题所在。我已经尽力检查了所有步骤,但似乎无法确定问题。提前致谢。更新:我尝试使用来自同一来源的不同shapefile。上面链接中的shapefile与以下网址(https://www.census.gov/geo/maps-data/data/cbf/cbf_counties.html)标记为“cb_2015_us_county_500k.zip”的文件相同。当我选择不同的shapefile(例如cb_2015_us_county_5m.zip)时,我得到了一个不同的地图,但是出现了相同的问题:请参见以下地图作为例子:
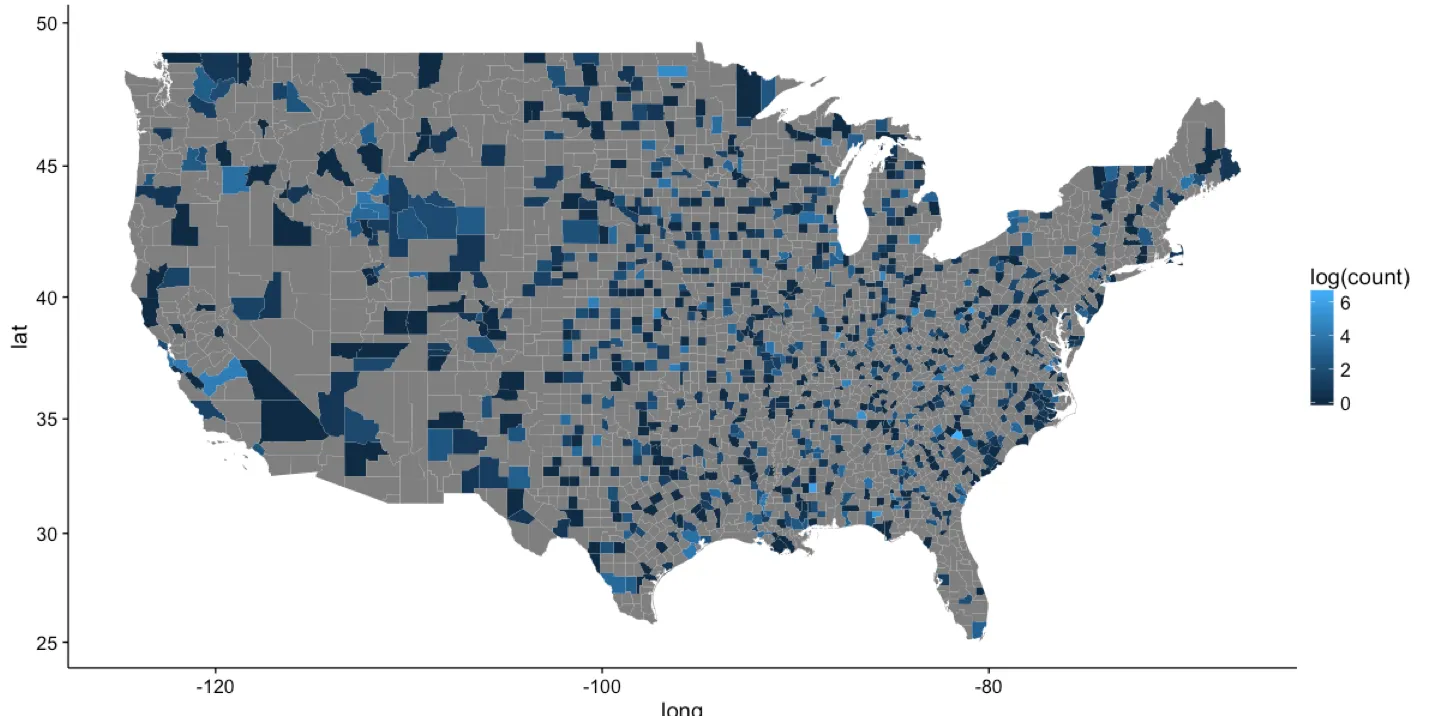
我不确定发生了什么事情!在这张新地图中,洛杉矶县甚至没有被着色,但橙县却被着色了!非常感谢任何帮助。
counties_composite() %>% subset(df$state %in% unique(df$state)) -> usa, 那么这一行会给我一个错误:coordinates(pts) <- ~long+lat Error in (function (classes, fdef, mtable) : unable to find an inherited method for function ‘coordinates<-’ for signature ‘"tbl_df"’。 - Cyrus Mohammadianpts<-as.data.frame(its)让它运行起来。 - Cyrus Mohammadian