R中逻辑回归的致死剂量(LD)置信区间

4
我希望能在R中找到Lethal Dose (LD50)及其置信区间。其他软件如Minitab、SPSS和SAS提供了三种不同版本的置信区间,但我无法在R中的任何包中找到这样的区间(我还使用了sos包中的findFn函数)。请问该如何寻找这样的区间?我已经编写了一种基于Delta方法的区间代码(但不确定其正确性),但希望能够使用来自R包的已建立的函数。谢谢。

MWE:

dose <- c(10.2, 7.7, 5.1, 3.8, 2.6, 0)
total <- c(50, 49, 46, 48, 50, 49) 
affected <- c(44, 42, 24, 16, 6, 0)
finney71 <- data.frame(dose, total, affected)


fm1 <- glm(cbind(affected, total-affected) ~ log(dose),
 family=binomial(link = logit), data=finney71[finney71$dose != 0, ])
summary(fm1)$coef

             Estimate Std. Error   z value     Pr(>|z|)
(Intercept) -4.886912  0.6429272 -7.601035 2.937717e-14
log(dose)    3.103545  0.3877178  8.004650 1.198070e-15


library(MASS)
xp <- dose.p(fm1, p=c(0.50, 0.90, 0.95))  # from MASS
xp.ci <- xp + attr(xp, "SE") %*% matrix(qnorm(1 - 0.05/2)*c(-1,1), nrow=1)
zp.est <- exp(cbind(xp, attr(xp, "SE"), xp.ci[,1], xp.ci[,2]))
dimnames(zp.est)[[2]] <- c("LD", "SE", "LCL","UCL")
zp.est  

                 LD       SE      LCL       UCL
p = 0.50:  4.828918 1.053044 4.363708  5.343724
p = 0.90:  9.802082 1.104050 8.073495 11.900771
p = 0.95: 12.470382 1.133880 9.748334 15.952512
1
我在LD50方面找不到很多R包,但是通过简要的文献搜索,我相信您正在正确地应用计算。您能否提供有关Minitab、SPSS和SAS使用的其他方法的任何信息,例如使用的统计检验名称?当您运行其他程序以获取CI时,您得到什么值? - pbible
在我看来,如果这样的函数存在,你已经尽力在 R 中找到它们了。 - cmbarbu
1个回答

8
drc 包中,您可以获得 ED50(相同的计算),以及置信区间。
library(drc) # Directly borrowed from the drc manual

mod <- drm(affected/total ~ dose, weights = total,
data = finney71[finney71$dose != 0, ], fct = LL2.2(), type = "binomial")

#intervals on log scale
ED(mod, c(50, 90, 95), interval = "fls", reference = "control") 

Estimated effective doses
(Back-transformed from log scale-based confidence interval(s))

     Estimate   Lower   Upper
1:50   4.8289  4.3637  5.3437
1:90   9.8021  8.0735 11.9008
1:95  12.4704  9.7483 15.9525

这与手动输出相匹配。

“finney71”数据包含在此软件包中,您对置信区间的计算完全drc团队给出的示例相匹配,甚至包括“# from MASS”注释。您应该归功于他们,而不是声称自己编写了代码。


还有其他几种方法可以解决这个问题。其中一种是使用参数化自助法,方便地通过boot包提供。

首先,我们将重新拟合模型。

library(boot)

finney71 <- finney71[finney71$dose != 0,] # pre-clean data 
fm1 <- glm(cbind(affected, total-affected) ~ log(dose),
                 family=binomial(link = logit), 
                 data=finney71)

作为说明,我们可以计算LD50和LD75。

statfun <- function(dat, ind) {
    mod <- update(fm1, data = dat[ind,])
    coefs <- coef(mod)
    c(exp(-coefs[1]/coefs[2]),
      exp((log(0.75/0.25) - coefs[2])/coefs[1]))
}

boot_out <- boot(data = finney71, statistic = statfun, R = 1000)

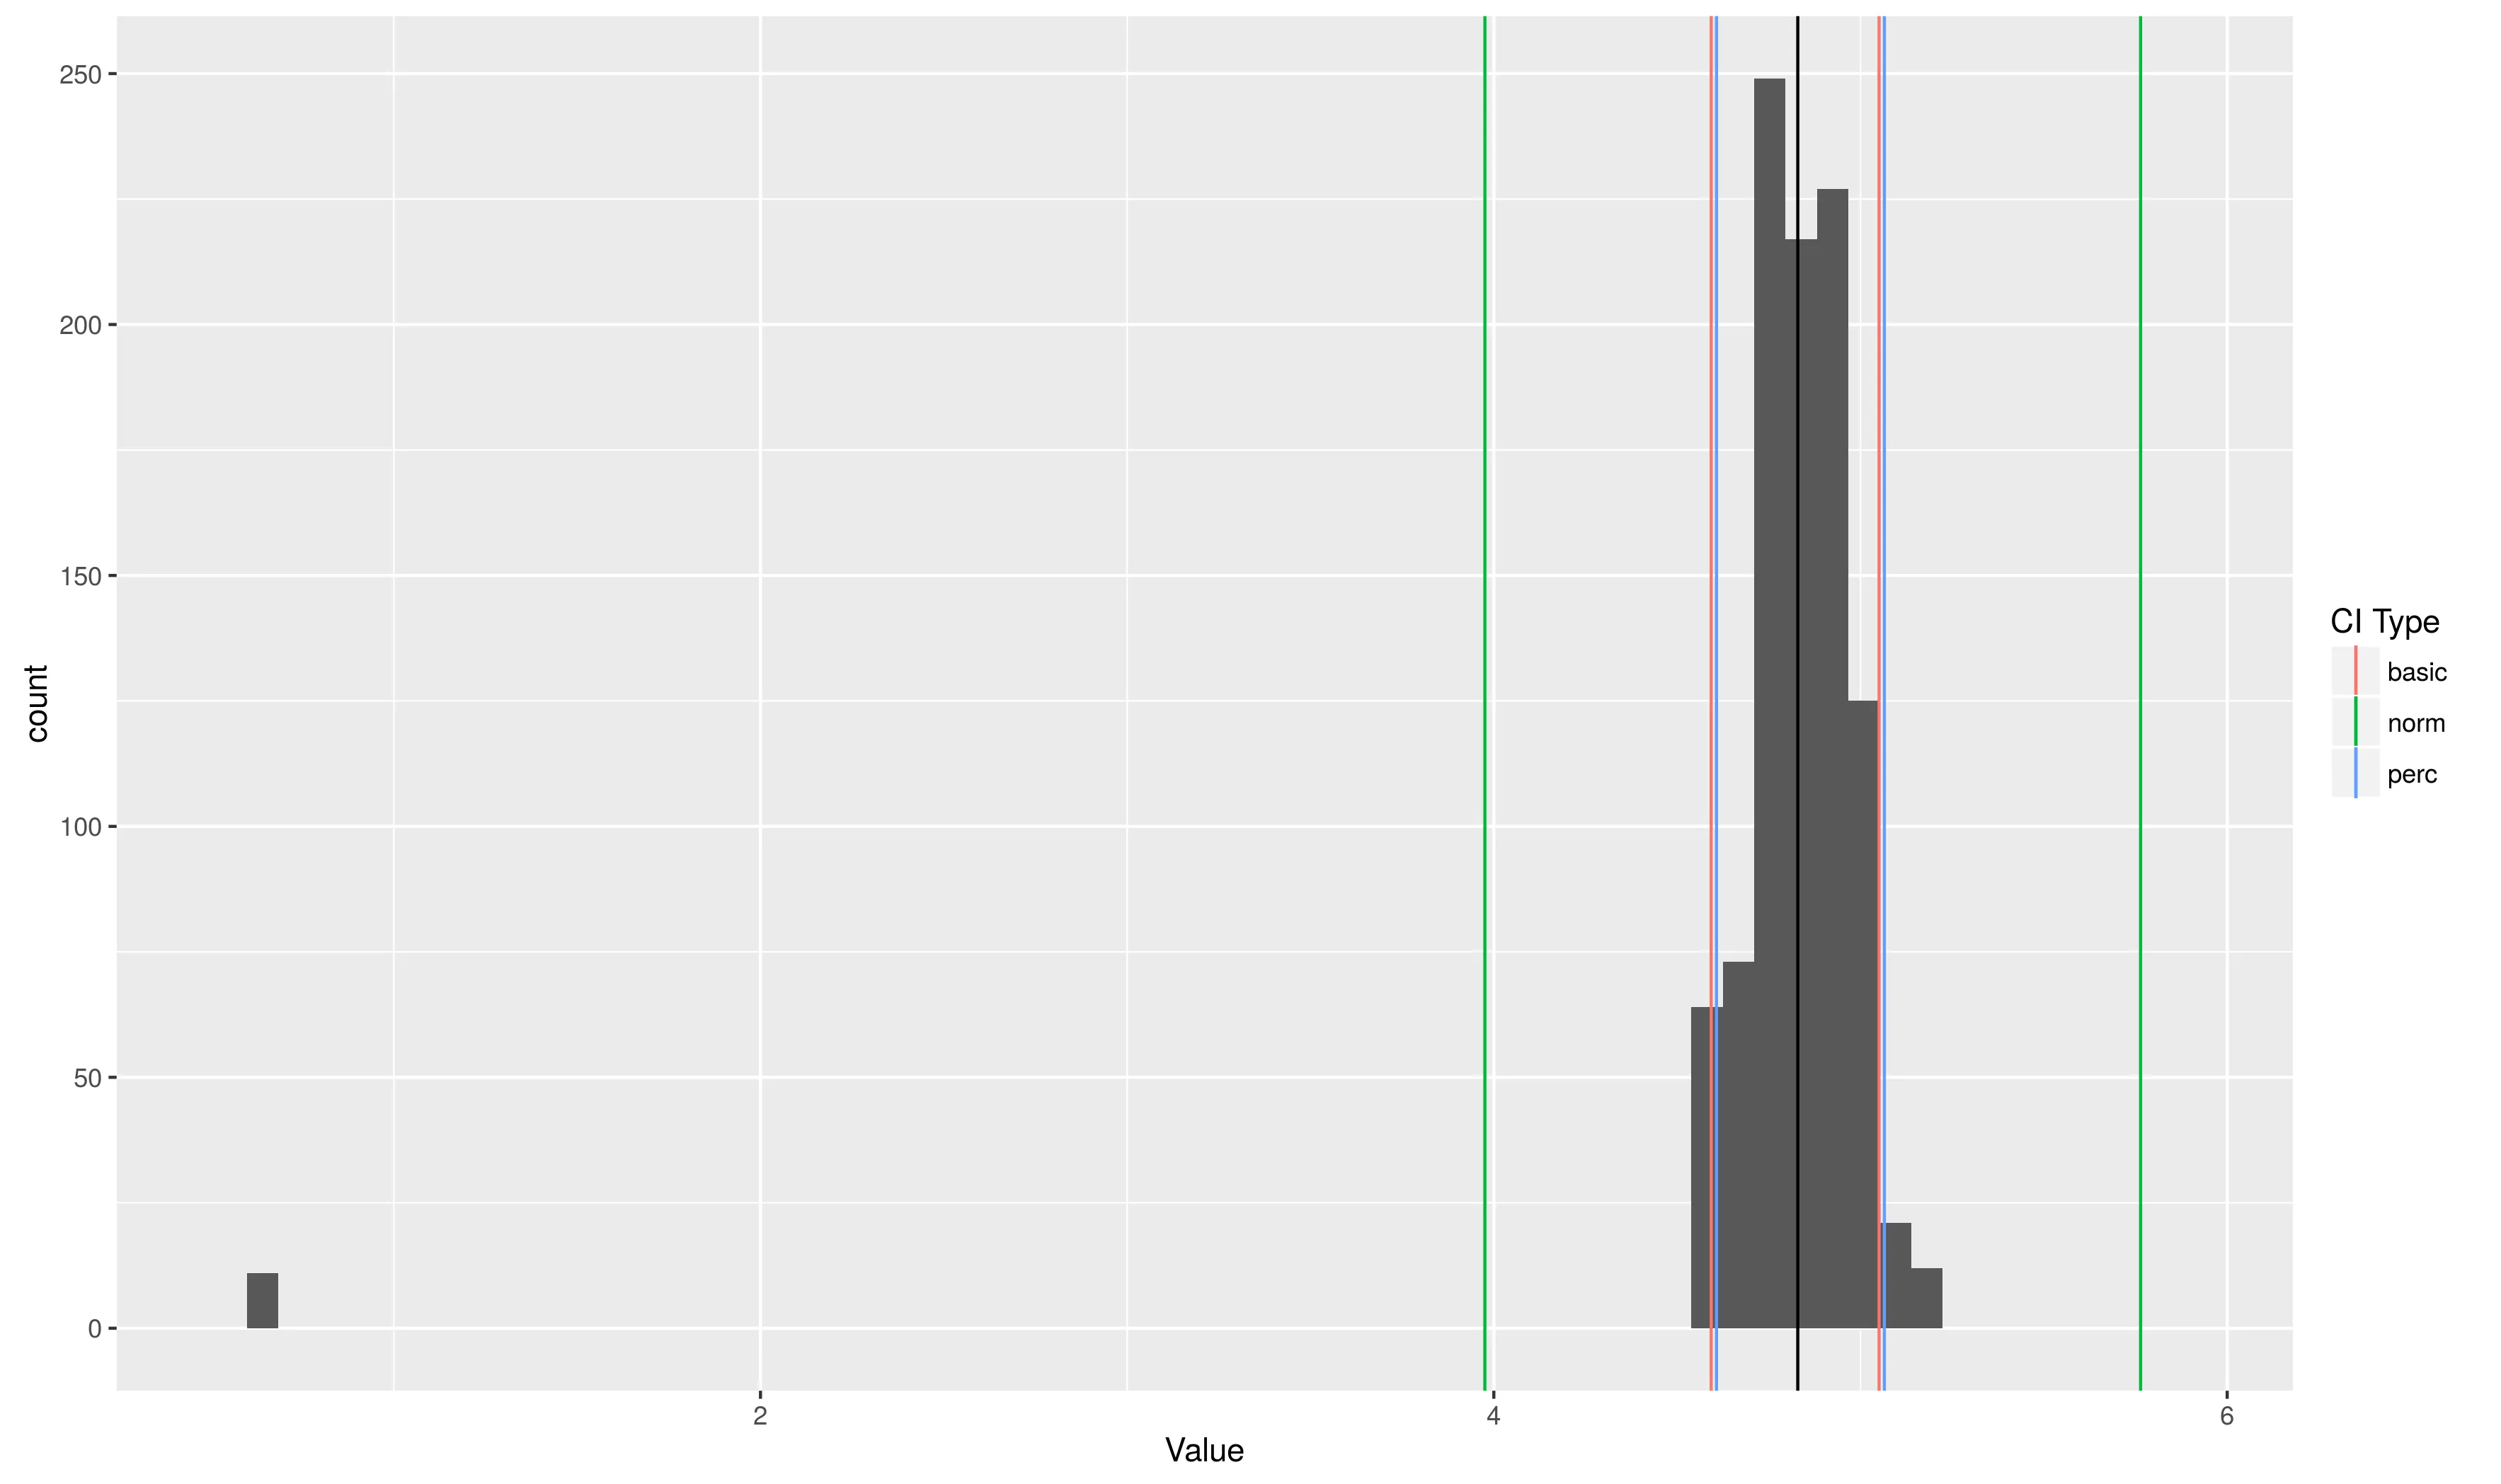
boot.ci函数可以利用这个对象为我们计算各种置信区间。

boot.ci(boot_out, index = 1, type = c('basic', 'perc', 'norm'))
##BOOTSTRAP CONFIDENCE INTERVAL CALCULATIONS
##Based on 999 bootstrap replicates
##
##CALL : 
##boot.ci(boot.out = boot_out, type = c("basic", "perc", "norm"), 
##    index = 1)

##Intervals : 
##Level      Normal              Basic              Percentile     
##95%   ( 3.976,  5.764 )   ( 4.593,  5.051 )   ( 4.607,  5.065 )  

enter image description here

使用正态近似的置信区间会因为一些极端值而受到很大影响,而基本和百分位数置信区间则更为稳健。有趣的是,如果斜率符号不明显,我们可能会得到一些非常极端的值(如this answer所模拟,并由Andrew Gelman在this blog post中进行了更全面的讨论)。
set.seed(1)
x <- rnorm(100)        
z = 0.05 + 0.1*x*rnorm(100, 0, 0.05) # small slope and more noise
pr = 1/(1+exp(-z))        
y = rbinom(1000, 1, pr)   
sim_dat <- data.frame(x, y)  
sim_mod <- glm(y ~ x, data = sim_dat, family = 'binomial')

statfun <- function(dat, ind) {
    mod <- update(sim_mod, data = dat[ind,])
    -coef(mod)[1]/coef(mod)[2]
}
sim_boot <- boot(data = sim_dat, statistic = statfun, R = 1000)
hist(sim_boot$t[,1], breaks = 100, 
          main = "Bootstrap of simulated model")

enter image description here

上面的 Delta 方法给出了平均值为 6.448,下限 CI 为 -36.22,上限 CI 为 49.12,并且所有的自助法 CI 都给出了类似极端的估计。
##Level      Normal              Basic              Percentile     
##95%   (-232.19,  247.76 )   ( -20.17,   45.13 )   ( -32.23,   33.06 )  

据我所知,LD50的置信区间正是常规解释(示例)。不确定为什么需要一个软件包。 - pbible

网页内容由stack overflow 提供, 点击上面的
可以查看英文原文,
原文链接