我需要绘制很多线条,并且希望在计算时显示它们的进度。代码大致如下:
x = arange(100000)
for y in range(100000):
    ax.plot(x*y)
    draw()
现在,你可以想象这会很快变慢。我在想我能做的是,绘制图形,将图形保存到缓冲区,清除图形,将缓冲区作为背景放置,然后绘制下一行。这样,我就不会有太多的Line2D对象了。有没有人有什么想法?
我需要绘制很多线条,并且希望在计算时显示它们的进度。代码大致如下:
x = arange(100000)
for y in range(100000):
ax.plot(x*y)
draw()
现在,你可以想象这会很快变慢。我在想我能做的是,绘制图形,将图形保存到缓冲区,清除图形,将缓冲区作为背景放置,然后绘制下一行。这样,我就不会有太多的Line2D对象了。有没有人有什么想法?
看起来你需要使用matplotlib的animation功能。这里提供动画示例。
编辑:我添加了自己版本的简单示例代码。
import random
from matplotlib import pyplot as plt
from matplotlib import animation

def data_generator(t):
    if t<100:
        return random.sample(range(100), 20)

def init():
    return plt.plot()

def animate(i):
    data = data_generator(i)
    return plt.plot(data, c='k')

fig = plt.figure()
anim = animation.FuncAnimation(fig, animate, init_func=init, frames=1000, interval=1000, blit=True)
plt.show()
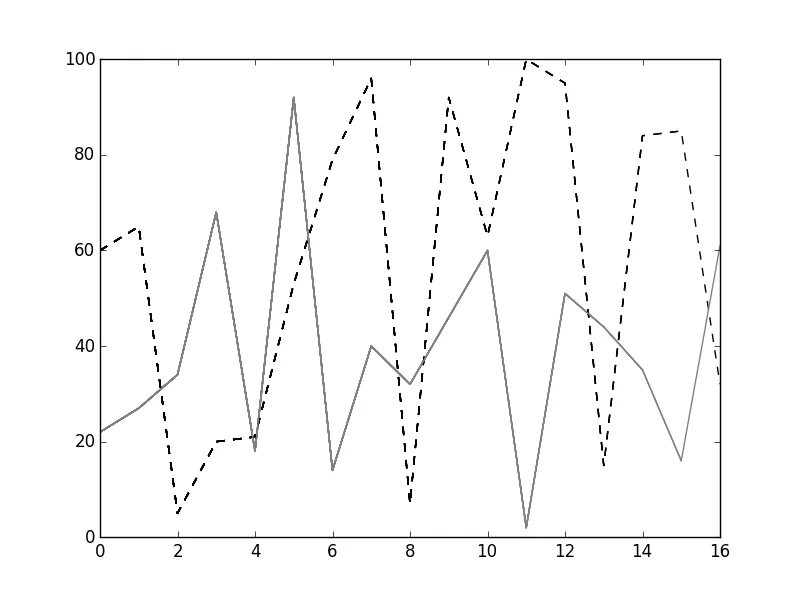
编辑2:多行实时更新版本。
import random
from matplotlib import pyplot as plt
from matplotlib import animation

def data_generator_1(t):
    if t<100:
        x1.append(t)
        y1.append(random.randint(1, 100))

def data_generator_2(t):
    if t<100:
        x2.append(t)
        y2.append(random.randint(1, 100))

def init():
    global x1
    global y1
    x1 = []
    y1 = []

    global x2
    global y2
    x2 = []
    y2 = []

    l1, l2 = plt.plot(x1, y1, x2, y2)
    return l1, l2

def animate(i):
    data_generator_1(i)
    data_generator_2(i)
    l1, l2 = plt.plot(x1, y1, x2, y2)
    plt.setp(l1, ls='--', c='k')
    plt.setp(l2, c='gray')
    return l1, l2

fig = plt.figure()
anim = animation.FuncAnimation(fig, animate, init_func=init, frames=1000, interval=1000, blit=True)
plt.show()
我相信有很多种方法可以不使用全局变量来绘制这种动画。这只是一个快速的尝试,以展示您想要的可能性。
针对您的第一条评论,我不知道ipython/vanilla脚本问题。所有示例均在普通编辑器(而非ipython)上编写。也许是matplotlib版本差异所致。
另外,如果您正在使用IPython笔记本,则可以使用IPython显示功能:
from IPython import display
import matplotlib.pyplot as plt
import numpy as np
%matplotlib

x = np.arange(100)

for y in np.arange(100):
    fig, ax = plt.subplots(1,1, figsize=(6,6))
    ax.plot(x * y)
    ax.set_ylim(0, 10000) # to keep the axes always the same
    display.clear_output(wait=True)
    display.display(fig)
    plt.close()
x = np.arange(100)
fig, ax = plt.subplots(1,1, figsize=(6,6))
for y in np.arange(100):
    ax.plot(x*y)
    ax.set_ylim(0,10000)
    display.clear_output(wait=True)
    display.display(fig)
    if y > 10:           # from the 10th iteration,
        ax.lines.pop(0)  # remove the first line, then the 2nd, etc..
                         # but it will always be in position `0`
plt.close()
HTH