将列表打印为表格数据

580

我是Python的新手,现在正在为如何漂亮地格式化我的数据以便于打印而苦恼。

我有一个列表用于两个标题,并且有一个矩阵应该作为表格的内容。就像这样:

teams_list = ["Man Utd", "Man City", "T Hotspur"]
data = np.array([[1, 2, 1],
                 [0, 1, 0],
                 [2, 4, 2]])

请注意,标题名称的长度不一定相同。数据条目都是整数。
现在,我想以表格格式表示这个内容,类似于下面这样:
            Man Utd   Man City   T Hotspur
  Man Utd         1          0           0
 Man City         1          1           0
T Hotspur         0          1           2

我有一种预感,这里一定有一个数据结构可以解决这个问题,但是我找不到它。我尝试使用字典和格式化打印,我尝试了缩进的for循环和字符串打印。

我相信一定有一种非常简单的方法来解决这个问题,但是由于缺乏经验,我可能错过了它。


2
+1,昨晚我也正在尝试做同样的事情。你只是想打印到命令行还是使用GUI模块? - HellaMad
只是在命令行打印。然而,它需要通过一个单元测试用例,因此格式非常重要。 - hjweide
3
可能是在Python中打印表格数据的重复问题。 - Ciro Santilli OurBigBook.com
1
可能是Python:漂亮打印ASCII表格?的重复问题。 - Martin Thoma
请注意,此处的要求相当专业化,因为行和列标签相同。因此,对于这种特殊情况,临时代码是如何简单实现的一个很好的例子。但其他解决方案在更通用的表格显示方面可能更好。 - nealmcb
22个回答

972
有一些轻巧实用的Python包可用于此目的:
1. tabulate: https://pypi.python.org/pypi/tabulate
from tabulate import tabulate
print(tabulate([['Alice', 24], ['Bob', 19]], headers=['Name', 'Age']))

Name      Age
------  -----
Alice      24
Bob        19

"tabulate有许多选项可指定标题和表格格式。"
print(tabulate([['Alice', 24], ['Bob', 19]], headers=['Name', 'Age'], tablefmt='orgtbl'))

| Name   |   Age |
|--------+-------|
| Alice  |    24 |
| Bob    |    19 |

2. PrettyTable: https://pypi.python.org/pypi/PrettyTable (注:该链接为英文网站)
from prettytable import PrettyTable
t = PrettyTable(['Name', 'Age'])
t.add_row(['Alice', 24])
t.add_row(['Bob', 19])
print(t)

+-------+-----+
|  Name | Age |
+-------+-----+
| Alice |  24 |
|  Bob  |  19 |
+-------+-----+

PrettyTable有从csv、html和sql数据库读取数据的选项。您还可以选择数据子集,对表进行排序并更改表格样式。
3. texttable:https://pypi.python.org/pypi/texttable
from texttable import Texttable
t = Texttable()
t.add_rows([['Name', 'Age'], ['Alice', 24], ['Bob', 19]])
print(t.draw())

+-------+-----+
| Name  | Age |
+=======+=====+
| Alice | 24  |
+-------+-----+
| Bob   | 19  |
+-------+-----+

使用texttable,您可以控制水平/垂直对齐、边框样式和数据类型。
4. termtables: https://github.com/nschloe/termtables
import termtables as tt

string = tt.to_string(
    [["Alice", 24], ["Bob", 19]],
    header=["Name", "Age"],
    style=tt.styles.ascii_thin_double,
    # alignment="ll",
    # padding=(0, 1),
)
print(string)

+-------+-----+
| Name  | Age |
+=======+=====+
| Alice | 24  |
+-------+-----+
| Bob   | 19  |
+-------+-----+

使用texttable,您可以控制水平/垂直对齐、边框样式和数据类型。
其他选项:
- terminaltables 轻松绘制终端/控制台应用程序中的表格,从字符串列表的列表中支持多行行。 - asciitable Asciitable 可以通过内置扩展读取器类读取和写入各种 ASCII 表格格式。

29
我发现tabulate是构建面向数据的CLI工具非常有用的工具。再加上click(pip install click),你就可以得到一个非常好用的组合了。 - alexbw
5
非常感谢,这太棒了。就个人而言,在这三个选项中,你更偏爱哪一个? - Jim Raynor
3
terminaltables 对于中文以及其他非英语语言来说都很好用。 - thinker3
8
我刚刚尝试过几个主要的软件包,我认为“beautifultable”是最好的选择,它有良好的API和文档支持,并且支持彩色效果。“texttable”也不错,但是当使用颜色时,排版会出现问题。“terminaltables”的功能也很不错,不过只提供代码示例的文档。 “PrettyTable”还可以,但是比较老旧,而且表格标题对我来说不太实用。 “Tabulate”也不错,但是官方pypi版本不支持列对齐的关键字“coalign”。而“tableprint”的表现一般,API复杂,同时缺乏常见用法示例。 - abulka
制表很棒!:D - sincorchetes
显示剩余6条评论

296

一些临时的代码:

row_format ="{:>15}" * (len(teams_list) + 1)
print(row_format.format("", *teams_list))
for team, row in zip(teams_list, data):
    print(row_format.format(team, *row))

这取决于 str.format()格式规范迷你语言


7
如果正文数据比标题数据更大,您可以根据数据的第一行设置列宽。 for t in data[0]: row_format+="{:<"+str(len(t)+5)+"}" - morgantaschuk
7
我更喜欢这个解决方案,因为它不需要第三方库。还想再加一个便捷的小技巧:你可以使用字符串的最大长度作为列的宽度,而不是硬编码的数字。这样写:f'{team:>{max_len_of_team}}'。 - Kirill

105
>>> import pandas
>>> pandas.DataFrame(data, teams_list, teams_list)
           Man Utd  Man City  T Hotspur
Man Utd    1        2         1        
Man City   0        1         0        
T Hotspur  2        4         2        

7
听起来很有前途,谢谢,但我试图在不使用除绝对必要的导入库之外的任何其他库的情况下完成这个任务。 - hjweide
44
仅仅为了输出格式而使用 pandas 似乎有些大材小用。 - Niels Bom
85
来看输出格式,留下来进行数据分析和建模:) - jfs
42
对我来说更像是“为了输出格式而来,由于10分钟的numpy编译让我的电脑发出吹风机的声音而惊叫着逃走”;-) - Niels Bom
4
现在大多数平台上的pip install numpy都使用二进制安装包(无需编译)。显然,在此之前就已经有其他的二进制安装选项。 - jfs
显示剩余3条评论

89

Python实际上使这变得非常容易。

像这样的东西

for i in range(10):
    print '%-12i%-12i' % (10 ** i, 20 ** i)

将会有输出结果

1           1           
10          20          
100         400         
1000        8000        
10000       160000      
100000      3200000     
1000000     64000000    
10000000    1280000000  
100000000   25600000000
1000000000  512000000000

%在字符串中实际上是转义字符,其后的字符告诉Python数据应该使用什么样的格式。而%位于字符串之外并且在字符串末尾,则表明你想要使用先前的字符串作为格式化字符串,并将随后的数据放入指定的格式中。

在这个例子中,我两次使用了"%-12i"。每个部分的含义如下:

'-' (left align)
'12' (how much space to be given to this part of the output)
'i' (we are printing an integer)

从文档中得知:https://docs.python.org/2/library/stdtypes.html#string-formatting


2
这个答案让我找到了我想要的!对于Python 3,我最终使用它像print('%-20.2f'%position ['deg'],'%-17.2f'%position ['v2']),其中.2指定了浮点数f的精度。 - Ross
1
我会将整数右对齐打印,但这只是个人偏好,我想。 - HelloGoodbye
1
还可以将其与f-string语法结合起来动态对齐:f"<%-{max(a)}s>" % 1 - suayip uzulmez

34

将Sven Marnach的答案更新以在Python 3.4中运行:

row_format ="{:>15}" * (len(teams_list) + 1)
print(row_format.format("", *teams_list))
for team, row in zip(teams_list, data):
    print(row_format.format(team, *row))

22

我知道我来晚了,但我刚刚为此制作了一个库,我认为它可能会很有帮助。它非常简单,这就是为什么我认为你应该使用它的原因。它叫做TableIT

基本用法

要使用它,首先请按照GitHub 页面上的下载说明进行操作。

然后导入它:

import TableIt

然后创建一个列表的列表,其中每个内部列表是一行:

table = [
    [4, 3, "Hi"],
    [2, 1, 808890312093],
    [5, "Hi", "Bye"]
]

然后你所要做的就是将其打印出来:

TableIt.printTable(table)

这是你得到的输出:

+--------------------------------------------+
| 4            | 3            | Hi           |
| 2            | 1            | 808890312093 |
| 5            | Hi           | Bye          |
+--------------------------------------------+

字段名称

如果您愿意,可以使用字段名称(如果您不使用字段名称,则无需设置useFieldNames=False,因为默认已设置为False):


TableIt.printTable(table, useFieldNames=True)

从中你将获得:

+--------------------------------------------+
| 4            | 3            | Hi           |
+--------------+--------------+--------------+
| 2            | 1            | 808890312093 |
| 5            | Hi           | Bye          |
+--------------------------------------------+

还有其他用途,例如你可以这样做:

import TableIt

myList = [
    ["Name", "Email"],
    ["Richard", "richard@fakeemail.com"],
    ["Tasha", "tash@fakeemail.com"]
]

TableIt.print(myList, useFieldNames=True)

由此可见:

+-----------------------------------------------+
| Name                  | Email                 |
+-----------------------+-----------------------+
| Richard               | richard@fakeemail.com |
| Tasha                 | tash@fakeemail.com    |
+-----------------------------------------------+

或者你可以这样做:

import TableIt

myList = [
    ["", "a", "b"],
    ["x", "a + x", "a + b"],
    ["z", "a + z", "z + b"]
]

TableIt.printTable(myList, useFieldNames=True)

因此,您得到:

+-----------------------+
|       | a     | b     |
+-------+-------+-------+
| x     | a + x | a + b |
| z     | a + z | z + b |
+-----------------------+

颜色

您也可以使用颜色。

通过使用颜色选项(默认情况下设置为None)并指定RGB值来使用颜色。

使用上面的示例:

import TableIt

myList = [
    ["", "a", "b"],
    ["x", "a + x", "a + b"],
    ["z", "a + z", "z + b"]
]

TableIt.printTable(myList, useFieldNames=True, color=(26, 156, 171))

那么您将会得到:

输入图像描述

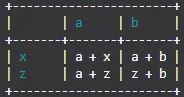
请注意,打印颜色可能对您无效,但它与其他打印彩色文本的库完全相同。我已经测试了每种颜色,没有任何问题,蓝色也不会出现错误,如果使用默认的34m ANSI转义序列(如果您不知道这是什么,也没关系),因为这一切都源于每种颜色都是RGB值而不是系统默认值。

更多信息

欲了解更多信息,请访问GitHub页面


TableIt是一个非常好的工具。简单而强大。我认为唯一的缺点是TableIt没有声明许可证。 - Endle_Zhenbo
@Endle_Zhenbo 嗨!非常感谢,我会尽快处理这个问题! - BeastCoder
2
@Endle_Zhenbo,我知道已经有一段时间了,但是我终于在项目上放置了一个许可证。 - BeastCoder
这个什么时候可以通过 pip 安装更新呢? - pasha
1
@pasha 我会在接下来的一周内发布它,不过我会尽量明天就发布! - BeastCoder
显示剩余2条评论

20

只需要使用它

from beautifultable import BeautifulTable

table = BeautifulTable()
table.column_headers = ["", "Man Utd","Man City","T Hotspur"]
table.append_row(['Man Utd',  1,  2,  3])
table.append_row(['Man City', 7, 4,  1])
table.append_row(['T Hotspur', 3, 2,  2])
print(table)

因此,您将获得如此整洁的表格,就是这样。 在这里输入图片描述


3
这些方法已被弃用,请改用table.rows.append()和table.columns.header - vladkras
我并没有尝试过所有其他方法,但在这许多年中,我自己编写了 printfcout<table>、PostScript 等等格式化方式。因此,我真的很欣赏一个好的表格格式化工具。真正打动我的是:table.set_style(BeautifulTable.STYLE_NONE) - Jim
无法根据索引进行对齐。 - Andrew

15

一种简单的方法是循环所有列,测量它们的宽度,为最大宽度创建一个行模板,然后打印行。这不完全是您要寻找的,因为在这种情况下,您首先必须将标题放在表格中,但我认为它可能对其他人有用。

table = [
    ["", "Man Utd", "Man City", "T Hotspur"],
    ["Man Utd", 1, 0, 0],
    ["Man City", 1, 1, 0],
    ["T Hotspur", 0, 1, 2],
]
def print_table(table):
    longest_cols = [
        (max([len(str(row[i])) for row in table]) + 3)
        for i in range(len(table[0]))
    ]
    row_format = "".join(["{:>" + str(longest_col) + "}" for longest_col in longest_cols])
    for row in table:
        print(row_format.format(*row))

你可以这样使用它:
>>> print_table(table)

            Man Utd   Man City   T Hotspur
  Man Utd         1          0           0
 Man City         1          1           0
T Hotspur         0          1           2

很好,为了最小化我们可以使用zip(*matrix)来获取列。所以要在列中获取最大长度:[len(max(col, key=len))+3 for col in zip(*table)]。我尝试使用.format和f-string与变量填充,并在稍后使用eval初始化f-string后应用填充长度。但是不成功,最终采用了这种方法。 - Rilwan
@Rilwan:你确定我们需要最小化吗?我对上面的可读性非常满意,特别是因为我是3年前写的,现在我仍然知道它的作用。 - Emil Stenström
不是必须的,只是我们的选择。由于我们有内置的zipper合并实用程序可用,我倾向于使用zip(* matrix)来获取列值,而不是通过索引迭代行并获取值。所以想分享一下。谢谢。 - Rilwan

12

当我这样做时,我希望能够控制表格格式的细节。特别是,我希望标题单元格具有不同于正文单元格的格式,并且表格列宽仅为每个列所需的宽度。以下是我的解决方案:

def format_matrix(header, matrix,
                  top_format, left_format, cell_format, row_delim, col_delim):
    table = [[''] + header] + [[name] + row for name, row in zip(header, matrix)]
    table_format = [['{:^{}}'] + len(header) * [top_format]] \
                 + len(matrix) * [[left_format] + len(header) * [cell_format]]
    col_widths = [max(
                      len(format.format(cell, 0))
                      for format, cell in zip(col_format, col))
                  for col_format, col in zip(zip(*table_format), zip(*table))]
    return row_delim.join(
               col_delim.join(
                   format.format(cell, width)
                   for format, cell, width in zip(row_format, row, col_widths))
               for row_format, row in zip(table_format, table))

print format_matrix(['Man Utd', 'Man City', 'T Hotspur', 'Really Long Column'],
                    [[1, 2, 1, -1], [0, 1, 0, 5], [2, 4, 2, 2], [0, 1, 0, 6]],
                    '{:^{}}', '{:<{}}', '{:>{}.3f}', '\n', ' | ')

这是输出结果:
                   | Man Utd | Man City | T Hotspur | Really Long Column
Man Utd            |   1.000 |    2.000 |     1.000 |             -1.000
Man City           |   0.000 |    1.000 |     0.000 |              5.000
T Hotspur          |   2.000 |    4.000 |     2.000 |              2.000
Really Long Column |   0.000 |    1.000 |     0.000 |              6.000

12

试试 Rich: https://github.com/Textualize/rich

from rich.console import Console
from rich.table import Table

console = Console()

table = Table(show_header=True, header_style="bold magenta")
table.add_column("Date", style="dim", width=12)
table.add_column("Title")
table.add_column("Production Budget", justify="right")
table.add_column("Box Office", justify="right")
table.add_row(
    "Dec 20, 2019", "Star Wars: The Rise of Skywalker", "$275,000,000", "$375,126,118"
)
table.add_row(
    "May 25, 2018",
    "[red]Solo[/red]: A Star Wars Story",
    "$275,000,000",
    "$393,151,347",
)
table.add_row(
    "Dec 15, 2017",
    "Star Wars Ep. VIII: The Last Jedi",
    "$262,000,000",
    "[bold]$1,332,539,889[/bold]",
)

console.print(table)

https://github.com/willmcgugan/rich/raw/master/imgs/table.png

enter image description here


我在 termtables 的回答中找到了这个链接,如果还没有的话,我会在这里添加它。我喜欢它的原因是我可以为选定的行设置颜色反转,并且可以混合样式。如果我所有的列都有特定的颜色,并且我的选定行的背景/前景颜色被反转,它会在每个单元格中应用两种样式。 - rtaft

网页内容由stack overflow 提供, 点击上面的
可以查看英文原文,
原文链接