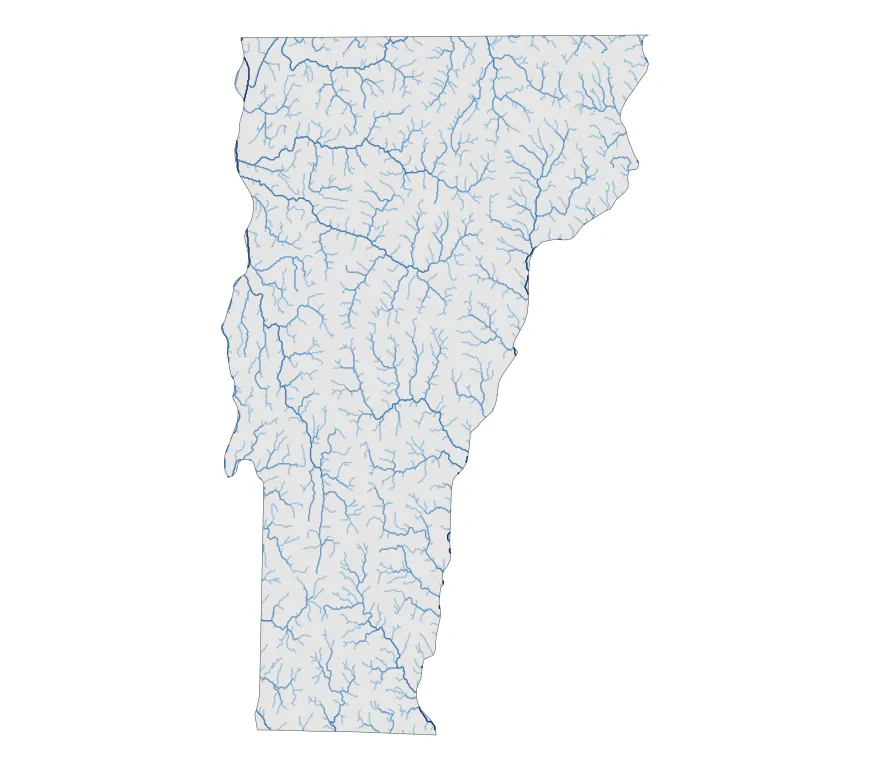
我有以下代码,它生成了一个佛蒙特州的水文地图,但我希望州外的所有地方都是白色的,这样边界州的水文数据就不会出现,佛蒙特州的边界也更清晰。有没有一种方法可以将水文数据过滤到只有佛蒙特州或在佛蒙特州几何数据范围之外的所有地方覆盖白色?
library(osmdata)
library(ggplot2)
library(tidyverse)
require(sf)
require(tigris)
library(httr)

bbx <- getbb("VT")

url <- "https://data.hydrosheds.org/file/HydroRIVERS/HydroRIVERS_v10_na_shp.zip"

res <- GET(url,
           write_disk("na_rivers.zip"),
           progress())
unzip("na_rivers.zip")
filenames <- list.files("HydroRIVERS_v10_na_shp", pattern="*.shp", full.names=T)

riv_list <- lapply(filenames, st_read)

list_riv <- lapply(filenames, sf::st_read)
na_riv <- list_riv[[1]] %>%
  sf::st_cast("MULTILINESTRING")

na_riv_width <- na_riv %>%
  dplyr::mutate(
    width = as.numeric(ORD_FLOW),
    width = dplyr::case_when(
      width == 3 ~ 1,
      width == 4 ~ 0.8,
      width == 5 ~ 0.6,
      width == 6 ~ 0.4,
      width == 7 ~ 0.2,
      width == 8 ~ 0.2,
      width == 9 ~ 0.1,
      width == 10 ~ 0.1,
      TRUE ~ 0
    )
  ) %>%
  sf::st_as_sf()

test<- na_riv_width %>% filter_state("South")

get_river_map <- function() {
  p <-
    ggplot() +
    geom_sf(
      data = na_riv_width,
      aes(
        color = factor(ORD_FLOW), size = width,
        alpha = factor(ORD_FLOW)
      )
    ) +
    coord_sf(xlim = c(min(bbx[1,]), max(bbx[1,])),
             ylim = c(min(bbx[2,]), max(bbx[2,])),
             expand = FALSE)  +
    labs(
      y = "", subtitle = "",
      x = "",
      title = "",
      caption = ""
    ) +
    scale_color_manual(
      name = "",
      values = c(
        "#08306b", "#08519c", "#2171b5",
                 "#4292c6", "#6baed6", "#9ecae1",
                 "#c6dbef", "#deebf7", "white"
      )
    ) +
    scale_size(range = c(0, .3)) +
    scale_alpha_manual(values = c(
      "3" = 1, "4" = 1, "5" = .7, "6" = .6,
      "7" = .4, "8" = .3, "9" = .2, "10" = .1
    )) +
    theme_minimal() +
    theme(
      panel.background = element_blank(),
      legend.background = element_blank(),
      legend.position = "none",
      panel.border = element_blank(),
      panel.grid.minor = element_blank(),
      panel.grid.major = element_blank(),
      plot.title = element_text(
        size = 40, color = "#2171b5", hjust = 0.5, vjust = 0
      ),
      plot.subtitle = element_text(
        size = 14, color = "#ac63a0", hjust = 0.5, vjust = 0
      ),
      plot.caption = element_text(
        size = 10, color = "grey60", hjust = 0.5, vjust = 10
      ),
      axis.title.x = element_text(
        size = 10, color = "grey20", hjust = 0.5, vjust = -6
      ),
      legend.text = element_text(
        size = 9, color = "grey20"
      ),
      legend.title = element_text(size = 10, color = "grey20"),
      strip.text = element_text(size = 12),
      plot.margin = unit(c(t = 1, r = -2, b = -1, l = -2), "lines"),
      axis.title.y = element_blank(),
      axis.ticks = element_blank(),
      axis.text.x = element_blank(),
      axis.text.y = element_blank()
    )

  return(p)
}

p1 <- get_river_map()
?st_crop。 - M--st_crop确实限制了数据,但我仍然看到河流分支进入邻近的州。 - Quinterpret