我有以下数据和代码用于制作此条形图:
tt = structure(c(21.5, 19.75, 15.05, 26.925, 19.75, NA, 28.2, 19.7,
15.4), .Dim = c(3L, 3L), .Dimnames = list(c("4", "6", "8"), c("3",
"4", "5")))
tt
3 4 5
4 21.50 26.925 28.2
6 19.75 19.750 19.7
8 15.05 NA 15.4
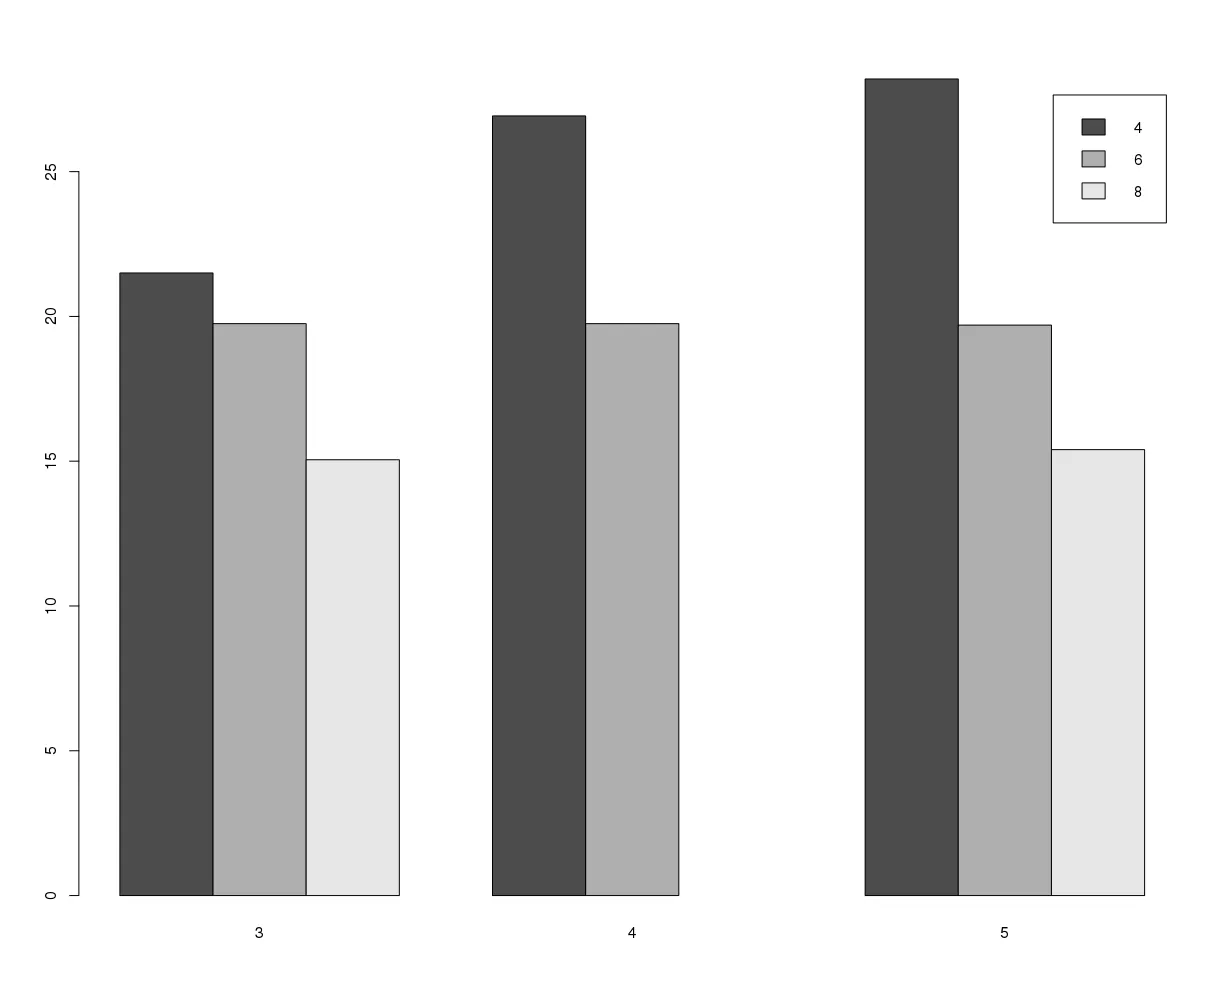
barplot(tt, beside=T, legend=rownames(tt))
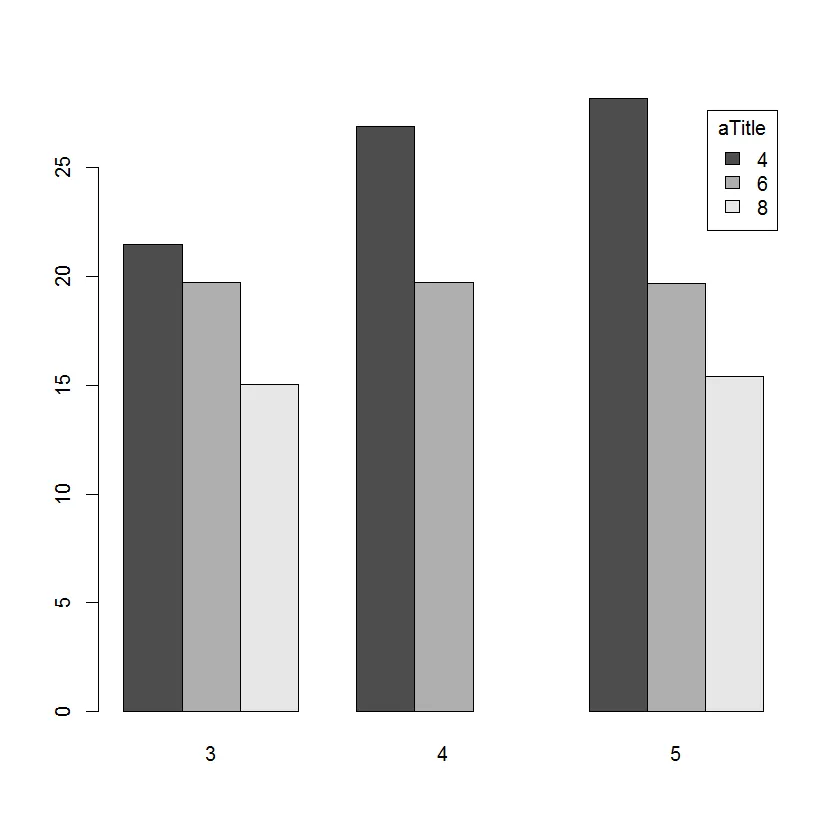
我想在图例框中添加一个标题(比如说“测试”)。我尝试了下面的方法,但是没有成功:
barplot(tt, beside=T, legend=rownames(tt), legend.text="Test")
also:
barplot(tt, beside=T, legend=rownames(tt))
legend("topright", legend="test")
感谢您的帮助。
T作为TRUE的缩写。T不是保留字。如果您运行以下代码:T <- "There I got you"并尝试重新绘制图形,您会立即看到为什么使用T是一个危险的想法。 - Joris Meys