在JS Leaflet中,您可以创建一个正方形的divIcon,并选择您喜欢的颜色,例如这个紫色的正方形标记: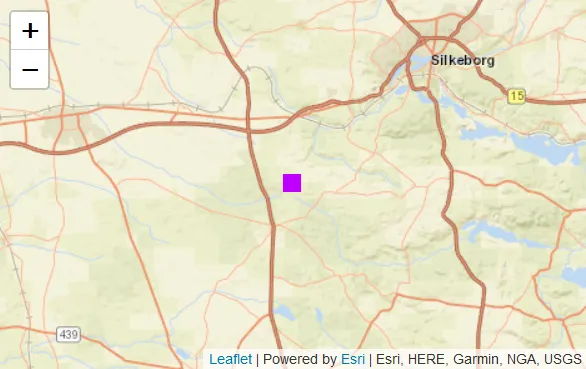 如何在Leaflet for R中实现这一点?奖励问题:如何使颜色取决于来自geojson数据的属性值?在这个例子中,该值的名称为"value"。
下面是我想要在R中复制的JS Leaflet的MVE:
这是一个在R中的MVE,我一直在尝试使用iconCreateFunction = JS(“…”)来实现所需的效果:
如何在Leaflet for R中实现这一点?奖励问题:如何使颜色取决于来自geojson数据的属性值?在这个例子中,该值的名称为"value"。下面是我想要在R中复制的JS Leaflet的MVE:
<html>
<head>
  <title>A Leaflet map!</title>
  <link rel="stylesheet" href="https://unpkg.com/leaflet@1.3.1/dist/leaflet.css"
        integrity="sha512-Rksm5RenBEKSKFjgI3a41vrjkw4EVPlJ3+OiI65vTjIdo9brlAacEuKOiQ5OFh7cOI1bkDwLqdLw3Zg0cRJAAQ=="
        crossorigin=""/>
    <script src="https://unpkg.com/leaflet@1.3.1/dist/leaflet.js"
        integrity="sha512-/Nsx9X4HebavoBvEBuyp3I7od5tA0UzAxs+j83KgC8PU0kgB4XiK4Lfe4y4cgBtaRJQEIFCW+oC506aPT2L1zw=="
        crossorigin="">
    </script>
    <script src="https://unpkg.com/esri-leaflet@2.2.4/dist/esri-leaflet.js"
    integrity="sha512-tyPum7h2h36X52O2gz+Pe8z/3l+Y9S1yEUscbVs5r5aEY5dFmP1WWRY/WLLElnFHa+k1JBQZSCDGwEAnm2IxAQ=="
    crossorigin=""></script>
  <style>
    body {margin: 0}
    #map{
        height: 100%;
        background-color: #FFF;
    }
    .layer-1-icon {
        background-color: #bf00ff;
    }
    .layer-1-label {
        background-color: rgba(255,255,255,0.8);
        box-shadow: none;
        color: #282828;
        padding: 2px;
        border: none;
        font-weight: 700;
        font-size: 14px;
    }
    .leaflet-tooltip-top:before,
    .leaflet-tooltip-bottom:before,
    .leaflet-tooltip-left:before,
    .leaflet-tooltip-right:before {
        position: absolute;
        pointer-events: none;
        border: 0px;
        background: transparent;
        content: "";
    }
  </style>
</head>
<body>

  <div id="map"></div>

  <!-- IMPORT OUR GEOJSON FILES -->
  <script>
var data = {
  "type": "FeatureCollection",
  "features": [
    {
      "type": "Feature",
      "geometry": {
        "type": "Point",
        "coordinates": [9.400038162145233,56.09709088979111]
      },
          "properties": {
        "Value": 76205,
        "Name": "A transformer"
      },
      "id": 0
    }]}
  </script>

  <script>
    // initialize the map
    var map = L.map('map').setView([56.09709088979111, 9.400038162145233], 10);

    // load a tile layer (docs here: https://esri.github.io/esri-leaflet/api-reference/layers/basemap-layer.html)
    var esri_streets = L.esri.basemapLayer("Streets").addTo(map);

    lyr1 = L.geoJSON(data, {
        //minZoom: 10,  <- Min zoom is NOT available for geoJSON layers. We need to control this ourselves in our map.on zoomend function
        onEachFeature: function (f, l) {
            l.bindPopup('<pre>'+JSON.stringify(f.properties,null,' ').replace(/[\{\}"]/g,'')+'</pre>');
            l.bindTooltip(f.properties.Name.toString(), {
                permanent: false,
                className: 'layer-1-label',
            })
        },
        pointToLayer: function(feature, latLng) {
            return L.marker(latLng, {
                icon: L.divIcon({
                    className: "layer-1-icon",
                    iconSize: 14,
                })
            })
        }
    }).addTo(map);

  </script>
</body>
</html>
这是一个在R中的MVE,我一直在尝试使用iconCreateFunction = JS(“…”)来实现所需的效果:
这里是一份R语言的最小可行性示例,我一直在使用iconCreateFunction = JS(“…”)进行试验,以达到期望的效果:
library(shiny)
library(leaflet)
library(geojsonio)
library(jsonlite)

# Define UI for application that draws a histogram
ui <- fluidPage(
  leafletOutput("mymap",width="100%"),

  tags$head(tags$style(HTML(
    ".layer-1-icon {
        background-color: #bf00ff;
      }"
  )))
)

data <- data.frame(name='A transformer',lat=56.097,lon=9.400,
                   value= 76205, `Voltage level`= 60000)
geojson_data <- geojson_sp(geojson_list(data, lat='lat', lon='lon'))

server <- function(input, output) {

  leaflet() %>% addTiles() %>%
    setView(9.4, 56.3, 8 ) %>%
    addMarkers(data=geojson_data,
               layerId = 1, group='Stationer',
               label = ~name,
               labelOptions = labelOptions(permanent=F),
               clusterOptions = markerClusterOptions(
                 iconCreateFunction =   JS("
                     function(cluster) {
                       return new L.DivIcon({
                         html: '<div><span>' + cluster.getChildCount() + '</div><span>',
                         className: 'layer-1-icon'
                       });
                     }
                     ")
               )
    )
}

shinyApp(ui = ui, server = server)