使用
我创建了一个名为
然而,如果您交换顺序,它会返回错误消息。
diamonds 数据集和下面的代码: library(dplyr)
library(ggplot2)
diam <- diamonds %>%
dplyr::select(cut, color, carat, price) %>%
dplyr::arrange(cut, color) %>%
dplyr::group_by(cut, color)
diam[c(10:30, 100:140, 300:500, 765:963,1476:1987,2469:3786,5000:6000,
8654:9876, 11000:12670, 21678:23456,35648:37896,
45469:46789,49876:51346), c(3, 4)] <- NA
write.csv(diam, "diam.csv")
我创建了一个名为
diam.csv的文件,用于下面的shiny应用程序。library(dplyr)
library(ggplot2)
library(shiny)
ui <- fluidPage(
titlePanel(
sidebarLayout(
sidebarPanel(
tags$h1(tags$strong("Shiny app")),
fileInput("file", "Upload your file"),
width =2),
mainPanel(width =10,
uiOutput("tb")))))
#server
server <- function(input,output){
data <- reactive({
file1 <- input$file
if(is.null(file1)){return()}
read.csv(file1$datapath, header=TRUE, sep=',')
})
output$sum <- renderTable({
if(is.null(data())){return ()}
df_summary <- data()
df_summary1 <- df_summary %>%
dplyr::select(cut, color, carat, price)
summary(df_summary1)
})
output$table <- renderDataTable({
if(is.null(data())){return ()}
data()
})
output$stats <- renderDataTable({
if(is.null(data())){return ()}
diam1 <- data()
print(
diam_stats <- diam1 %>%
dplyr::select(cut, color, carat) %>%
dplyr::arrange(cut, color) %>%
dplyr::group_by(cut, color) %>%
dplyr::filter(!is.na(carat)) %>%
dplyr::summarise_each(funs(
mean(., na.rm=T),
sd(., na.rm=T),
n()))
)
})
output$tb <- renderUI({
if(is.null(data()))
h5()
else
tabsetPanel(type="tab",
tabPanel(h3("Summary", align="center"),
tableOutput("sum")),
tabPanel(h3("Data"),
dataTableOutput("table")),
tabPanel(h3("Stats"),
dataTableOutput("stats")))
})
}
shinyApp(ui = ui, server = server)
我在汇总标签页中遇到了以下错误:
"c('standardGeneric', 'genericFunction', 'function', 'OptionalFunction', 'PossibleMethod', 'optionalMethod')"类对象应用'select_'方法未被识别。
在统计标签页中也出现了以下错误:
"funs"参数缺失,无默认值。
我使用的是 dplyr_0.4.3 版本。有什么解决这些问题的建议吗?
更新
以下是错误的打印屏幕:
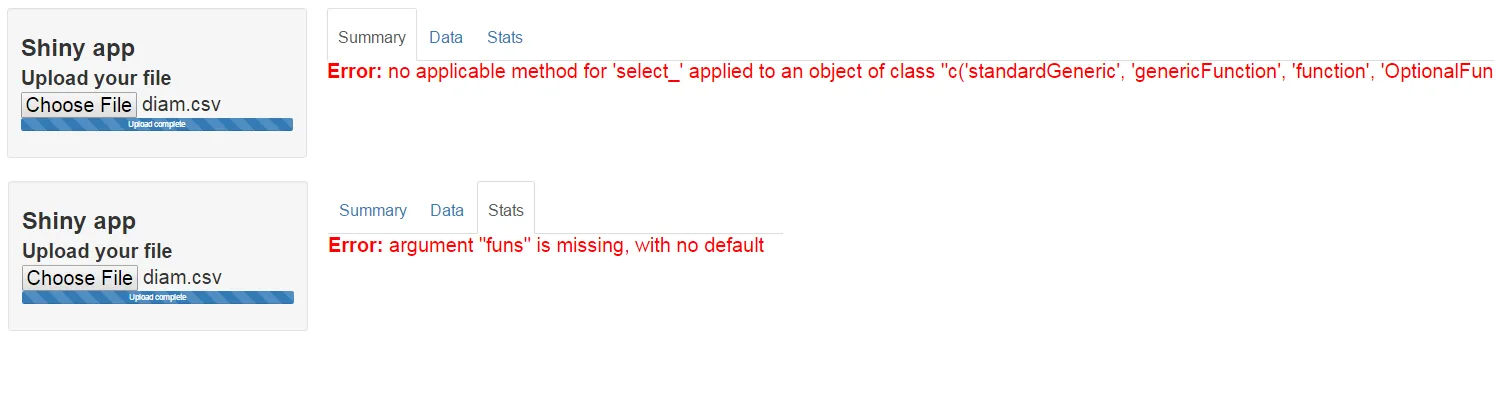
这是控制台中显示的内容:
Listening on http://127.0.0.1:3606
Warning: Error in UseMethod: no applicable method for 'select_' applied to an object of class "c('standardGeneric', 'genericFunction', 'function', 'OptionalFunction', 'PossibleMethod', 'optionalMethod')"
Stack trace (innermost first):
    73: select_
    72: dplyr::select
    71: ..redirect
    70: %>%
    69: renderTable [C:\R\Shiny\diam_app/app.R#28]
    68: func
    67: output$sum
     1: runApp
Warning: Error in lazyeval::as.lazy_dots: argument "funs" is missing, with no default
Stack trace (innermost first):
    83: lazyeval::as.lazy_dots
    82: funs_
    81: inherits
    80: is.fun_list
    79: stopifnot
    78: colwise_
    77: summarise_each_
    76: dplyr::summarise_each
    75: ..redirect
    74: %>%
    73: print
    72: exprFunc [C:\R\Shiny\diam_app/app.R#42]
    71: widgetFunc
    70: func
    69: renderFunc
    68: output$stats
     1: runApp
这里是sessioninfo()函数。
    R version 3.2.5 (2016-04-14)
Platform: x86_64-w64-mingw32/x64 (64-bit)
Running under: Windows 7 x64 (build 7601) Service Pack 1

locale:
[1] LC_COLLATE=English_New Zealand.1252  LC_CTYPE=English_New Zealand.1252    LC_MONETARY=English_New Zealand.1252 LC_NUMERIC=C
[5] LC_TIME=English_New Zealand.1252

attached base packages:
[1] stats     graphics  grDevices utils     datasets  methods   base

other attached packages:
 [1] lazyeval_0.1.10     EcoHydRology_0.4.12 DEoptim_2.2-3       topmodel_0.7.2-2    operators_0.1-8     plotly_3.4.13       googleVis_0.5.10
 [8] tidyr_0.4.1         raster_2.5-2        leaflet_1.0.1       chron_2.3-47        date_1.2-34         scales_0.4.0        dplyr_0.4.3
[15] DT_0.1              ggplot2_2.1.0       pixmap_0.4-11       RgoogleMaps_1.2.0.7 sp_1.2-3            XML_3.98-1.4        shiny_0.13.2

loaded via a namespace (and not attached):
 [1] reshape2_1.4.1   lattice_0.20-33  colorspace_1.2-6 htmltools_0.3.5  yaml_2.1.13      base64enc_0.1-3  withr_1.0.1      DBI_0.3.1
 [9] plyr_1.8.3       stringr_1.0.0    munsell_0.4.3    gtable_0.2.0     htmlwidgets_0.6  devtools_1.11.1  memoise_1.0.0    labeling_0.3
[17] httpuv_1.3.3     curl_0.9.7       parallel_3.2.5   Rcpp_0.12.4      xtable_1.8-2     jsonlite_0.9.19  mime_0.4         gridExtra_2.2.1
[25] png_0.1-7        digest_0.6.9     stringi_1.0-1    RJSONIO_1.3-0    grid_3.2.5       tools_3.2.5      magrittr_1.5     assertthat_0.1
[33] httr_1.1.0       viridis_0.3.4    R6_2.1.2         git2r_0.14.0
更新 5月4日
我没有意识到EcoHydRology_0.4.12软件包是这个错误消息的源头。这就是为什么它没有包含在上面的示例中。
感谢@enpitsu指出问题的来源以及他通过先加载EcoHydRology软件包然后再加载dplyr的好解决方案。
以下是一个示例,可以重现相同的错误,包括EcoHydRology_0.4.12。
如果按照以下顺序加载软件包,则示例将正常工作
library(EcoHydRology)
library(dplyr)
然而,如果您交换顺序,它会返回错误消息。
set.seed(123)
date <-  rep (as.Date(seq(as.Date("2003-01-01"), as.Date("2008-05-31"), by = 1), format="%Y-%m-%d"), 2)
siteID <- c(rep("site1", 1978), rep("site2", 1978))
flow   <- runif(3956, 48530, 1250365)
df   <- data.frame(date, siteID, flow)

library(dplyr)
library(EcoHydRology)

df1 <- df %>%
  dplyr::select(siteID, flow) %>%
  dplyr::group_by(siteID) %>%
  dplyr::do(cbind(., BaseflowSeparation(.$flow, filter_parameter = 0.925, passes = 3)))

summary(df1)

df2 <- df1 %>%
  dplyr::select(siteID, flow, bt, qft) %>%
  dplyr::group_by(siteID) %>%
  dplyr::summarise_each(funs(
    mean(., na.rm=T),
    sd(., na.rm=T),
    n()))

df2