我希望使用androidPlot库绘制像y=x^2+1这样的数学函数。我有"SimpleXYPlot"。它可以工作,但我不知道如何将其从sin更改为我的函数。
以下是代码:
以下是代码:
   public class DynamicXYPlotActivity extends Activity {

// redraws a plot whenever an update is received:
private class MyPlotUpdater implements Observer {
    Plot plot;

    public MyPlotUpdater(Plot plot) {
        this.plot = plot;
    }

    @Override
    public void update(Observable o, Object arg) {
        plot.redraw();
    }
}

private XYPlot dynamicPlot;
private MyPlotUpdater plotUpdater;
SampleDynamicXYDatasource data;
private Thread myThread;

@Override
public void onCreate(Bundle savedInstanceState) {

    // android boilerplate stuff
    super.onCreate(savedInstanceState);
    setContentView(R.layout.dynamicxyplot_example);

    // get handles to our View defined in layout.xml:
    dynamicPlot = (XYPlot) findViewById(R.id.dynamicXYPlot);

    plotUpdater = new MyPlotUpdater(dynamicPlot);

    // only display whole numbers in domain labels
    dynamicPlot.getGraphWidget().setDomainValueFormat(new DecimalFormat("0"));

    // getInstance and position datasets:
    data = new SampleDynamicXYDatasource();
    SampleDynamicSeries sine1Series = new SampleDynamicSeries(data, 0, "Sine 1");
    SampleDynamicSeries sine2Series = new SampleDynamicSeries(data, 1, "Sine 2");

    LineAndPointFormatter formatter1 = new LineAndPointFormatter( Color.rgb(0, 0, 0), null, null, null );
    formatter1.getLinePaint().setStrokeJoin(Paint.Join.ROUND);
    formatter1.getLinePaint().setStrokeWidth(10);
    dynamicPlot.addSeries( sine1Series,formatter1 );

    LineAndPointFormatter formatter2 = new LineAndPointFormatter(Color.rgb(0, 0, 200), null, null, null);
    formatter2.getLinePaint().setStrokeWidth(10);
    formatter2.getLinePaint().setStrokeJoin(Paint.Join.ROUND);

    //formatter2.getFillPaint().setAlpha(220);
    dynamicPlot.addSeries(sine2Series, formatter2);

    // hook up the plotUpdater to the data model:
    data.addObserver(plotUpdater);

    // thin out domain tick labels so they dont overlap each other:
    dynamicPlot.setDomainStepMode(XYStepMode.INCREMENT_BY_VAL);
    dynamicPlot.setDomainStepValue(5);

    dynamicPlot.setRangeStepMode(XYStepMode.INCREMENT_BY_VAL);
    dynamicPlot.setRangeStepValue(10);

    dynamicPlot.setRangeValueFormat(new DecimalFormat("###.#"));

    // uncomment this line to freeze the range boundaries:
    dynamicPlot.setRangeBoundaries(-100, 100, BoundaryMode.FIXED);

    // create a dash effect for domain and range grid lines:
    DashPathEffect dashFx = new DashPathEffect(
            new float[] {PixelUtils.dpToPix(3), PixelUtils.dpToPix(3)}, 0);
    dynamicPlot.getGraphWidget().getDomainGridLinePaint().setPathEffect(dashFx);
    dynamicPlot.getGraphWidget().getRangeGridLinePaint().setPathEffect(dashFx);
}

@Override
public void onResume() {
    // kick off the data generating thread:
    myThread = new Thread(data);
    myThread.start();
    super.onResume();
}

@Override
public void onPause() {
    data.stopThread();
    super.onPause();
}

class SampleDynamicXYDatasource implements Runnable {

    // encapsulates management of the observers watching this datasource for update events:
    class MyObservable extends Observable {
        @Override
        public void notifyObservers() {
            setChanged();
            super.notifyObservers();
        }
    }

    private static final double FREQUENCY = 5; // larger is lower frequency
    private static final int MAX_AMP_SEED = 100; //100
    private static final int MIN_AMP_SEED = 10;  //10
    private static final int AMP_STEP = 1;
    public static final int SINE1 = 0;
    public static final int SINE2 = 1;
    private static final int SAMPLE_SIZE = 30;
    private int phase = 0;
    private int sinAmp = 1;
    private MyObservable notifier;
    private boolean keepRunning = false;

    {
        notifier = new MyObservable();
    }

    public void stopThread() {
        keepRunning = false;
    }

    //@Override
    public void run() {
        try {
            keepRunning = true;
            boolean isRising = true;
            while (keepRunning) {

                Thread.sleep(100); // decrease or remove to speed up the refresh rate.

                phase++;
                if (sinAmp >= MAX_AMP_SEED) {
                    isRising = false;
                } else if (sinAmp <= MIN_AMP_SEED) {
                    isRising = true;
                }

                if (isRising) {
                    sinAmp += AMP_STEP;
                } else {
                    sinAmp -= AMP_STEP;
                }
                notifier.notifyObservers();
            }
        } catch (InterruptedException e) {
            e.printStackTrace();
        }
    }


    public int getItemCount(int series) {
        return SAMPLE_SIZE;
    }

    public Number getX(int series, int index) {
        if (index >= SAMPLE_SIZE) {
            throw new IllegalArgumentException();
        }
        return index;
    }

    public Number getY(int series, int index) {
        if (index >= SAMPLE_SIZE) {
            throw new IllegalArgumentException();
        }
        double angle = (index + (phase))/FREQUENCY;
        double amp = sinAmp * Math.sin(angle);
        switch (series) {
            case SINE1:
                return amp;
            case SINE2:
                return -amp;
            default:
                throw new IllegalArgumentException();
        }
    }

    public void addObserver(Observer observer) {
        notifier.addObserver(observer);
    }

    public void removeObserver(Observer observer) {
        notifier.deleteObserver(observer);
    }

}

class SampleDynamicSeries implements XYSeries {
    private SampleDynamicXYDatasource datasource;
    private int seriesIndex;
    private String title;

    public SampleDynamicSeries(SampleDynamicXYDatasource datasource, int seriesIndex, String title) {
        this.datasource = datasource;
        this.seriesIndex = seriesIndex;
        this.title = title;
    }

    @Override
    public String getTitle() {
        return title;
    }

    @Override
    public int size() {
        return datasource.getItemCount(seriesIndex);
    }

    @Override
    public Number getX(int index) {
        return datasource.getX(seriesIndex, index);
    }

    @Override
    public Number getY(int index) {
        return datasource.getY(seriesIndex, index);
    }
    }
    }
=======================================================
在“Nick”说了些什么和其他小的补充之后,我得到了这个结果:
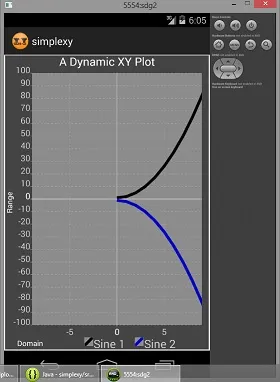
但如我们所知:
现在如何制作左侧?