我有一个使用p5.js制作的指数曲线,随着时间的推移自行绘制如下:
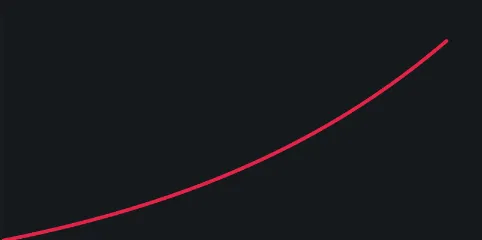
在网站上找到的工作示例 正如您在此示例中看到的,一旦到达画布的边缘,它就会“缩小”,以使画布适合整个曲线,结果由于它从未离开画布,因此曲线弯曲越来越多。
为了尝试实现这一点,我探索使用缩放
scale(x / 100, y / 100) ,一旦画布的限制达到,就会触发。这样,画布开始按比例缩放曲线的扩展。然而,使用这种方法并不能解决我的问题,因为似乎在向曲线添加点的同时减小缩放并不会使曲线再次增长。
以下是我的当前(更新后)代码:
var y = 49;
var x = 0;
var inc = 0.02;
var translateY;
let createTopY = false;
let createTopX = false;
var topY;
var percentageIncY = 100;
var perecntageIncX = 100;
// Scaling
var scaleX = 1
var scaleY = 1

function setup() {
  createCanvas(400, 200);
  background(20, 25, 29)
}

function draw() {

  frameRate(20)

  // Set curve history for continuous lines
  let prev_x = x
  let prev_y = y

  // Recreate canvas position (origin) based on Scale Y (zoom)
  translateY = height * scaleY
  translate(0, (height - translateY) + 49 ) // 49 is the initial y value
  scale(scaleX, scaleY)

  // Exponential curve values
  x = x + 5 // Approximate
  y = y + y * inc

  // Draw curve
  strokeWeight(3)
  stroke(229, 34, 71);
  line(prev_x, height - prev_y, x, height - y);

  // Create topY when top at scale(1) is reached
  if (createTopY !== true) checkInt(y)
  if (createTopX !== true) checkInt(x)

  //-------------- SCALING ---------------//

  // From TopX, decrease scale exponentialy
  if (x > width - 20) { // Temporarily set to 20 (50-30) to better visualize

    // The increased value of x in % starting at topX
    percentageIncX = (x * 100) / (width - 20)

    // Decrease scaleX exponentialy
    scaleX = 100 / percentageIncX

    print(
      "% increase X: " +
      percentageIncX
    )
  }

  // From topY, decrease scale exponentialy
  if (y > height + 20) { // Temporarily set to 20 (50-30) to visualize

    // The increased value of y in % starting at topY
    percentageIncY = (y * 100) / (height + 20) // Temporarily set to 20 (50-30) to better visualize

    // Decrease scaleY exponentialy
    scaleY = 100 / percentageIncY

    print(
      "% increase Y: " +
      percentageIncY
    )
  }
  //-------------------------------------//
}

const checkInt = (prop) => {
  const parsed = int(prop)

  if (parsed > height + 20) { // Temporarily set to 20 (50-30) to better visualize
    createTopY = true
    createTopX = true
    topY = y
    print('createTopY is: ' + createTopY)
    print('createTopX is: ' + createTopX)
    print("---START SCALING---")
    print('starting at ' + y)
  }
}<script src="https://cdnjs.cloudflare.com/ajax/libs/p5.js/1.1.9/p5.min.js"></script>
p5.js是否有像Javascript一样的setInterval函数?如果有,您可以使用它来调度椭圆绘制函数,从而追踪曲线。 - SuperJumboframeRate()来控制每秒显示的帧数。然而,我不理解你的问题。你所说的“它总是完全可见”是什么意思?你想要画一条没有中断的曲线吗? - Rabbid76