1个回答
15
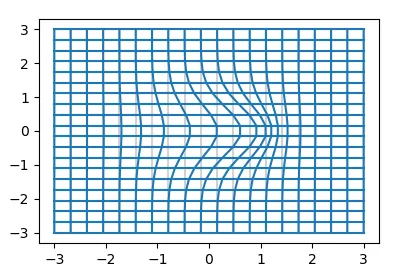
我猜测这张图片是通过在网格上添加一些高斯函数来产生的。
import numpy as np
import matplotlib.pyplot as plt
from matplotlib.collections import LineCollection

def plot_grid(x,y, ax=None, **kwargs):
    ax = ax or plt.gca()
    segs1 = np.stack((x,y), axis=2)
    segs2 = segs1.transpose(1,0,2)
    ax.add_collection(LineCollection(segs1, **kwargs))
    ax.add_collection(LineCollection(segs2, **kwargs))
    ax.autoscale()


f = lambda x,y : ( x+0.8*np.exp(-x**2-y**2),y )

fig, ax = plt.subplots()

grid_x,grid_y = np.meshgrid(np.linspace(-3,3,20),np.linspace(-3,3,20))
plot_grid(grid_x,grid_y, ax=ax,  color="lightgrey")

distx, disty = f(grid_x,grid_y)
plot_grid(distx, disty, ax=ax, color="C0")

plt.show()
- ImportanceOfBeingErnest
1
2非常感谢。这正是我正在寻找的! - Fabio Rangel
网页内容由stack overflow 提供, 点击上面的可以查看英文原文,
原文链接
原文链接