JavaScript D3.js:使用brush.extent初始化刷子并防止数据溢出边缘。

4

我有两个问题需要解决,它们都与我的d3应用程序有关,该应用程序基于这个

以下是代码:http://jsfiddle.net/zoa5m20z/

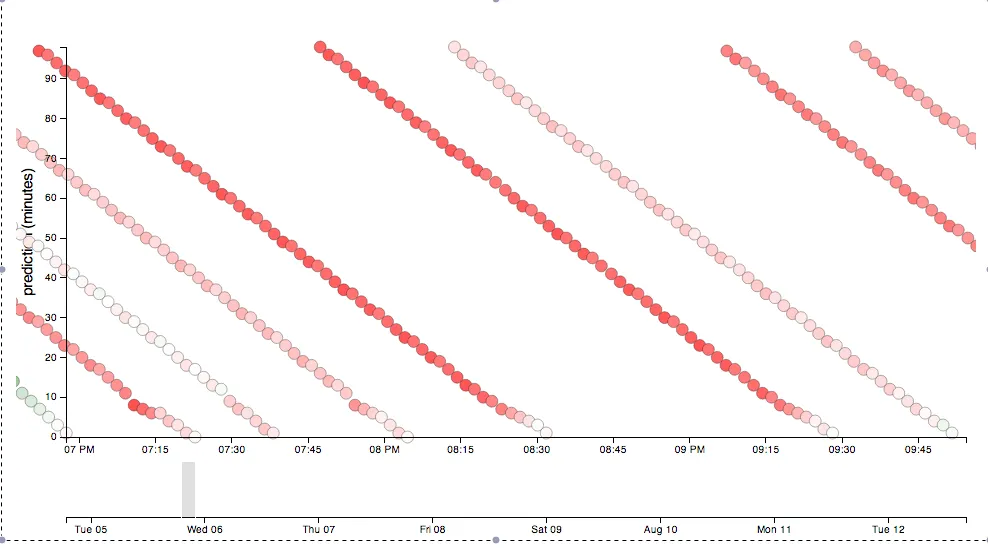
  1. I want to initialize my brush so that only a small specific portion is brushed by default when the app starts up. I tried the following with .extent but with no luck.

    //date parsing function
    var parseDate = d3.time.format("%Y-%m-%d %H:%M:%S").parse;
    
    //setting up brush and defaultExtent
    var brush = d3.svg.brush()
    .x(x2)
    .extent([parseDate("2014-08-11 10:20:00"), parseDate("2014-08-11 18:20:00")]) //trying to intialize brush
    .on("brush", brushed);
    
  2. I want to stop my plotted circles from overlapping with the yaxis. I'd like to only plot/show circles to the right of the y-axis when the brush is moved. Just like the canonical Bostock Focus+Context via Brushing Block. I tried playing with the margins and the scales, domains, ranges but to no avail yet.

我想要避免的问题:

在此输入图片描述

我对 d3.js 新手,欢迎并感激所有提示和建议!


1
对于第二个问题,您可以在父级SVG中定义一个clipPath,并将其应用于包含标记的组。我建议将此问题拆分为两个单独的问题,以获得更好的答案机会。祝好! - Pablo Navarro
2个回答

3

对于你的第一个问题,你需要调用brush.event来使画刷选择新的范围。

  brush = d3.svg.brush()
      .x(x)
      .extent([config.start, d3.time.day.offset(config.start, config.range)])
      .on("brush", brushmove)
      .on("brushend", brushend);

  gBrush = svg.select('.brush')
    .call(brush);

  gBrush.call(brush.event);

针对您的第二个问题,我通常会过滤出在刷选范围之外的数据,这样我就只绘制可见数据。以下是一个示例,它将在您的刷选/缩放事件中调用:

  // update the data so that only visible points are shown
  var points= svg.selectAll('.point')
      .data(function(d) { return onScreen(d, brush.extent); },
            function(d) { return d.id; });

  // draw the points that are now onscreen
  var pointsEnter = points.enter().append('g').attr('class', 'point');

  // remove any points that are now offscreen
  points.exit().remove();

  // up date the x/y position of your points based on the new axis.
  // ... left up to you

为了在画笔移动时能够直接将点翻译到它们的新位置,而不必销毁并重新绘制它们,因此为这些点分配一个唯一的id很有帮助。

我有一个使用这些技术的示例,在http://bl.ocks.org/bunkat/1962173上。


2
这是一个基于您的代码的工作示例:http://jsfiddle.net/26sd8uc9/4/ 1- 您关于 .extent 的看法是正确的,问题在于您没有为 x2 比例尺指定域。通过添加以下代码即可解决:
x2 = d3.time.scale()
   .domain([
     parseDate("2014-08-11 05:30:00"), 
     parseDate("2014-08-12 19:25:00")
   ])
   .nice(d3.time.minute)
   .range([0, width]);

要初始化圆形,您还需要在创建刷子后调用brushed事件,方法是添加.call(brush.event)

  // brush slider display
  context.append("g")
      .attr("class", "x brush")
      .call(brush)
      .call(brush.event)
      .selectAll("rect")
      .attr("y", -6)
      .attr("height", height2 + 7);

2 - 使用变量来跟踪刷子下的当前范围,并通过将半径设置为零(或者你可以设置可见性)来隐藏不在范围内的圆圈。

var currentRange;

var inRange = function(d) { 
    if(!currentRange || d.time < currentRange[0] || d.time > currentRange[1] ) {
        return 0;
    } else {
        return 5;
    }
}

function brushed() {

  currentRange = (brush.empty()? undefined : brush.extent());

  x.domain(brush.empty() ? x2.domain() : brush.extent());
  focus.select(".x.axis").call(xAxis);
  mydots.selectAll(".circle")
   .attr("cx", xMap)
   .attr("cy", yMap)
   .attr("r", inRange); // set radius to zero if it's not in range
  console.log(brush.extent())
}

关于规模定义,最好写成这样:

        .domain([
            d3.min(dataset, function(d){ return d.time; }), 
            d3.max(dataset, function(d){ return d.time; })
        ])

在你的示例中,你需要确保在执行此操作之前解析和初始化数据。


如果您正在寻找更复杂的示例,这里有一个使用非常相似的方法:https://github.com/parano/Global-Terrorism-Visualization - Chaoyu
我采用了你提供的解决方案,两个问题都解决了 - 非常好。谢谢!不过,对于问题1有一个疑问:x2域选择的日期会影响图表: .domain([ parseDate("2014-08-11 05:30:00"), parseDate("2014-08-12 19:25:00")只有当这些日期是完整范围的最小值和最大值时才有逻辑意义。我尝试使用d3.extent(dataset.map(function(d) { return d.time; })),但在定义域时我的数据还没有被定义。现在我正在硬编码它们。有更简洁的方法吗? - ajb
1
你可以尝试将x2比例的定义放在initialize函数内部。这样,当你定义域时,数据已经被加载和解析了。 - Chaoyu

网页内容由stack overflow 提供, 点击上面的
可以查看英文原文,
原文链接