我正在使用ggplot2创建一个箱线图。我能够成功地创建箱线图,但在使用ggplot2中的facet时合并两个功能时遇到了问题:
这是我的代码:
- 当分面时,条带文本应包含列名和列值(由
facet_grid()中的labeller=label_both参数给出)。 - 分面应该分成我想要的行数和列数(由
facet_wrap()中的nrow和ncol参数给出)。
>tmpdf

    value  treat FoldChange Gene Pvalue.Adj
 523.8589 Normal     -1.899    A    0.02828
 489.7638 Normal     -1.899    A    0.02828
 642.0126 Cancer     -1.899    A    0.02828
 928.8136 Cancer     -1.899    A    0.02828
 624.7892 Normal     -1.899    A    0.02828
  53.8685 Normal     -7.135    B    0.00012
 184.6473 Normal     -7.135    B    0.00012
  76.2712 Cancer     -7.135    B    0.00012
  48.0607 Cancer     -7.135    B    0.00012
 177.9528 Normal     -7.135    B    0.00012
4581.2847 Normal     -1.886    C    0.04924
7711.3411 Normal     -1.886    C    0.04924
6007.9852 Cancer     -1.886    C    0.04924
5940.9232 Cancer     -1.886    C    0.04924
4433.0949 Normal     -1.886    C    0.04924
 171.9172 Normal     -4.594    D    0.00093
 316.3900 Cancer     -4.594    D    0.00093
 231.3177 Cancer     -4.594    D    0.00093
 295.1096 Normal     -4.594    D    0.00093
 322.8346 Normal     -4.594    D    0.00093
这是我的代码:
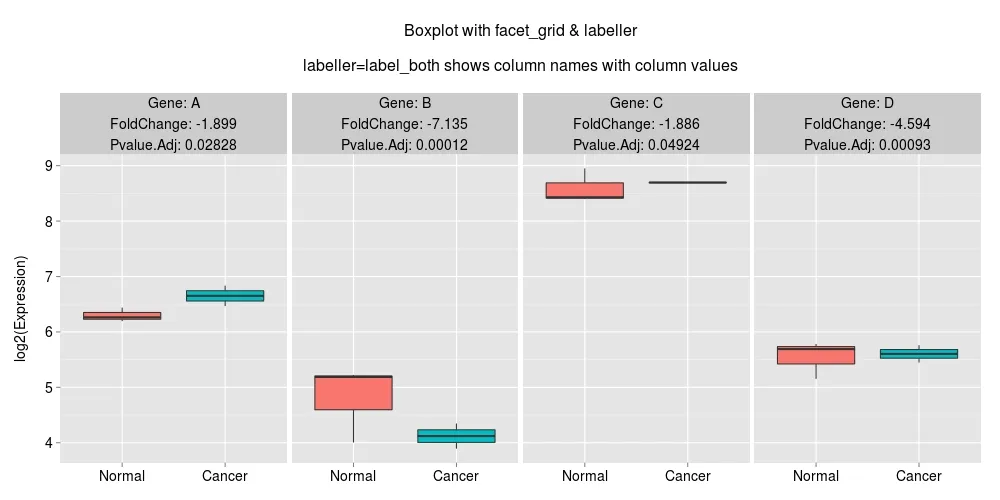
#Here I am using facet_grid and labeller=label_both, this gives me column names & column values in the facet strip text but I am unable to divide the plot into columns & rows.

ggplot(tmpdf,aes(x=treat,y=log(value+1),fill=treat)) + geom_boxplot(show_guide=F) +
facet_grid(~Gene+FoldChange+Pvalue.Adj,labeller=label_both) + ylab("log2(Expression)\n") +
ggtitle("Boxplot with facet_grid & labeller\n\nlabeller=label_both shows column names with column values\n") +
theme(axis.text.x=element_text(size=14,color="black"),
    axis.text.y=element_text(size=14,color="black"),
    strip.text=element_text(size=14,color="black"),
    axis.title.x=element_blank(),
    axis.title.y=element_text(size=14,color="black"),
    plot.title=element_text(size=16,color="black"))

#This creates the following plot:
#And here is the second code:
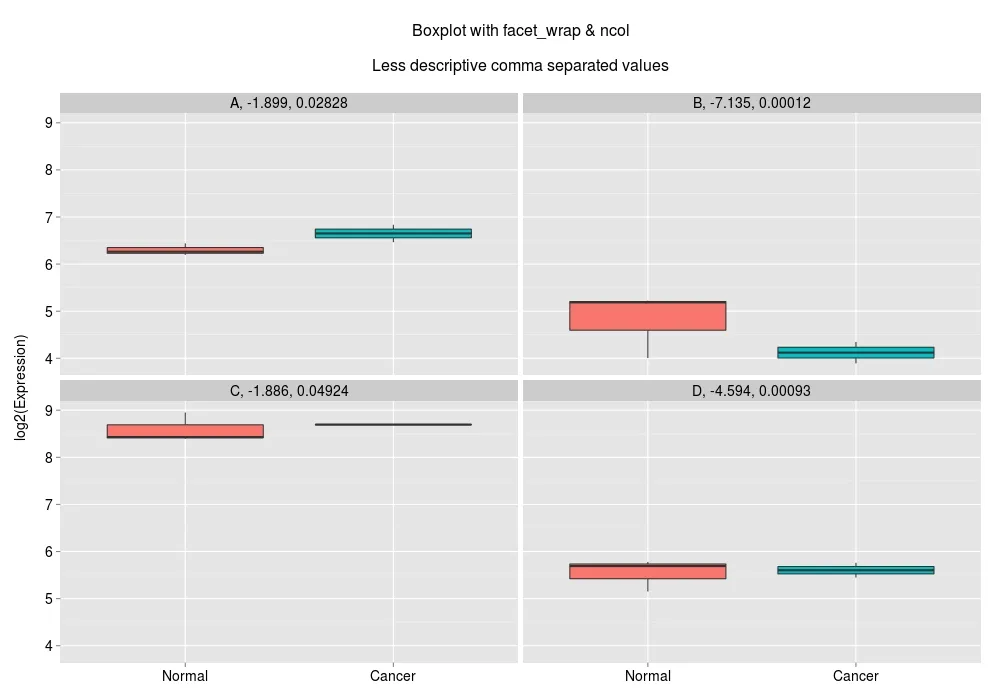
#This divides the plot into as many columns as I want but doesn't show the column name in the facet strip text.
#Strip text contains comma-separated values that are less informative.
ggplot(tmpdf,aes(x=treat,y=log(value+1),fill=treat)) + geom_boxplot(show_guide=F) +
facet_wrap(~Gene+FoldChange+Pvalue.Adj,ncol=2) + ylab("log2(Expression)\n") +
ggtitle("Boxplot with facet_wrap & ncol\n\nDoesn't show column name\n") +
theme(axis.text.x=element_text(size=14,color="black"),
axis.text.y=element_text(size=14,color="black"),
strip.text=element_text(size=14,color="black"),
axis.title.x=element_blank(),
axis.title.y=element_text(size=14,color="black"),
plot.title=element_text(size=16,color="black"))
#This creates the following plot:
我该如何将我的图形分成多列/行,并在分面中包含一个包含列名和值的描述性条纹文本?
facet_wrap更改为使用数学表达式,但是同样的想法也可以用于更改文本。 - MrFlickfacet_wrap没有像facet_grid一样的标签。 - MrFlick