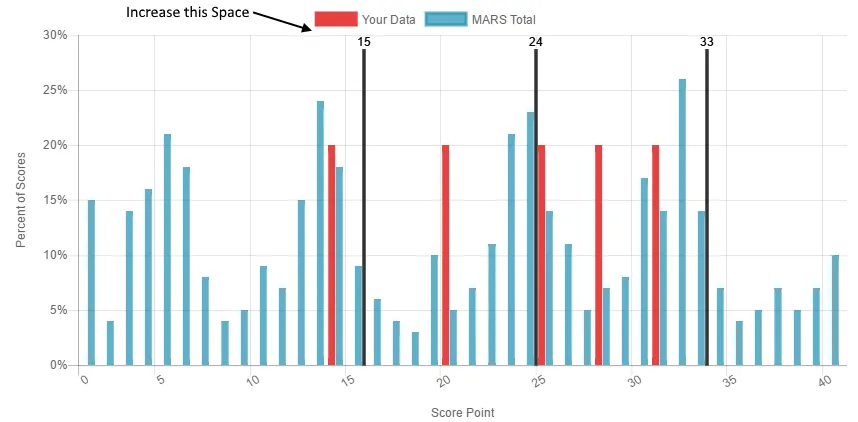
我有一个条形图,在其中绘制了3条垂直线,每条线都有其自己的标签。我希望这些标签出现在y轴上方(例如在30%线条之上),但在图例下方。我无法找到如何增加顶部图例和图表之间的空间,以便我可以让我的垂直线标签(15、24和33)不接触图表本身,但在图例下方。有什么想法吗?
如果您想增加所有图表中的间距,您可以在创建之前添加以下代码:
Chart.Legend.prototype.afterFit = function() {
    this.height = this.height + 50;
};
当然,我没有尝试过,但我认为你可以改变它(或在此之前复制原始图表对象,以保留原始填充)。
再见,
如果您想在应用程序中仅对一些图表应用图例下方填充:
ChartJS >= 2.1.0
Chart.plugins.register({
  id: 'paddingBelowLegends',
  beforeInit: function(chart, options) {
    chart.legend.afterFit = function() {
      this.height = this.height + 50;
    };
  }
});

// ----------------------------------
// disable the plugin only for charts
// where you DO NOT WANT the padding
// ----------------------------------

// for raw ChartJS use:
var chart = new Chart(ctx, {
  config: {
    plugins: {
      paddingBelowLegends: false
    }
  }
});

// for angular-chartjs:
$scope.myChart.options.plugins = { paddingBelowLegends: false }
// then in template:
// <canvas class="chart ..." chart-options="myChart.options" ... />
ChartJS >= 2.5.0
支持每种图表的特定插件,可以实现以下操作:
var chart = new Chart(ctx, {
  plugins: [{
    beforeInit: function(chart, options) {
      chart.legend.afterFit = function() {
        this.height = this.height + 50;
      };
    }
  }]
});
如果有人想知道为什么在Chart.js 3.3.0中afterFit解决方案不起作用,那是因为afterFit函数已从图例插件中删除。
如果您想通过利用fit函数使其正常工作,可以尝试这个hacky解决方案/解决方法:
const plugin = {
  beforeInit(chart) {
    // Get a reference to the original fit function
    const originalFit = chart.legend.fit;

    // Override the fit function
    chart.legend.fit = function fit() {
      // Call the original function and bind scope in order to use `this` correctly inside it
      originalFit.bind(chart.legend)();
      // Change the height as suggested in other answers
      this.height += 15;
    }
  }
}
我知道这不是一个理想的解决方案,但在我们有原生支持这个图例填充的之前,恐怕现在这就是我们能够做到的最好了。
很遗憾,因为没有配置选项来处理这个问题,您能够实现所需的结果的唯一方法是扩展Chart.Legend并实现afterFit()回调函数。
这里有一个快速的codepen示例,展示如何做到这一点。要更改间距,只需更改第9行中的值(当前设置为50)。此外,这当然仅适用于顶部的图例。希望这个示例足够清晰,让您在需要将图例移动到其他位置时进行修改。
Chart.Legend.prototype.afterFit = function() {
    this.height = this.height + 50;
};
请在module.ts文件中更新此内容。
我正在使用react-chartjs-2(但这只是一个端口,并使用相同的配置对象),我能够通过更改嵌套在图例配置中的标签配置来实现这一点:
chartOptions = {
  legend: {
    labels: {
      padding: 50 -> this one.
    }
  },
注意:请确保将其添加到plugins而不是options.plugins中。
Chart.plugins.register({
  id: 'paddingBelowLegends',
  beforeInit: function(chart, options) {
    chart.legend.afterFit = function() {
      this.height = this.height + 50;
    };
  }
});

// ----------------------------------
// disable the plugin only for charts
// where you DO NOT WANT the padding
// ----------------------------------

// for raw ChartJS use:
var chart = new Chart(ctx, {
  config: {
    plugins: {
      paddingBelowLegends: false
    }
  }
});
对于使用 react-chartjs-2 的 React 用户:
import { Line } from "react-chartjs-2";
import { Chart as ChartJS, CategoryScale, LinearScale, PointElement, LineElement, Title, Tooltip, Legend } from "chart.js";
  ChartJS.register(CategoryScale, LinearScale, PointElement, LineElement, Title, Tooltip, Legend);
<Line
        data={{
          datasets: trendsData?.map((trend, idx) => ({
            type: "line",
            label: trend.domainName,
            data: trend.domainTrends.map(d => d.value),
            backgroundColor: getDomainColor(idx).backgroundColor,
            borderColor: getDomainColor(idx).color,
            pointRadius: 0,
            tension: 0.3
          })),
          labels: trendsData?.[0]?.domainTrends.map(d => d.date)
        }}
        options={{
          plugins: {
            legend: {
              display: true,
              align: "start",
              labels: {
                font: { size: 14 }
              }
            }
          }
        }}
        plugins={[
          {
            id: "increase-legend-spacing",
            beforeInit(chart) {
              // Get reference to the original fit function
              const originalFit = (chart.legend as any).fit;
              // Override the fit function
              (chart.legend as any).fit = function fit() {
                // Call original function and bind scope in order to use `this` correctly inside it
                originalFit.bind(chart.legend)();
                this.height += 20;
              };
            }
          }
        ]}
      />
对于ng2-charts@^3.1.0,按照这个答案进行操作即可,在此增加一步:
this.options.labels.padding = 40;
//this.height += 15;
title.padding配置(这将在图形下创建一个不可见的标题,因此有点hacky): plugins: {
legend: {
display: true,
position: 'bottom',
title: {
display: true,
padding: 10,
},
react-chartjs-2并且想避免使用自定义插件,那么一个巧妙的解决方案是使用一个带有空标签的虚假x轴。<Chart options={{
scales: {
x: {
// Your real x-axis options
},
xTopPadding: {
// Fake x-axis for padding
position: 'top',
labels: [''],
grid: {
drawOnChartArea: false,
drawTicks: true,
ticksWidth: 0,
ticksLength: 0, // Increase ticksLength to increase the "padding"
},
}
}
}} />