NVD3折线图X轴刻度缺失。

8

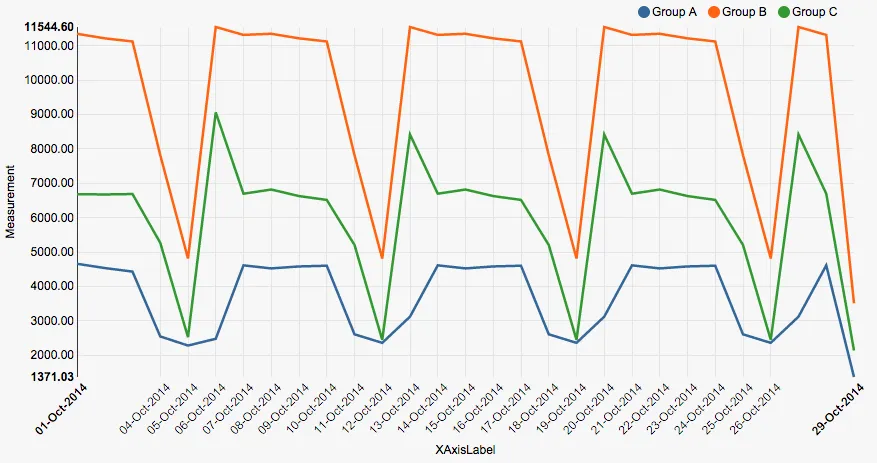
我正在使用NVD3显示折线图,链接如下:http://jsbin.com/xodaxafiti/2/edit?js,output

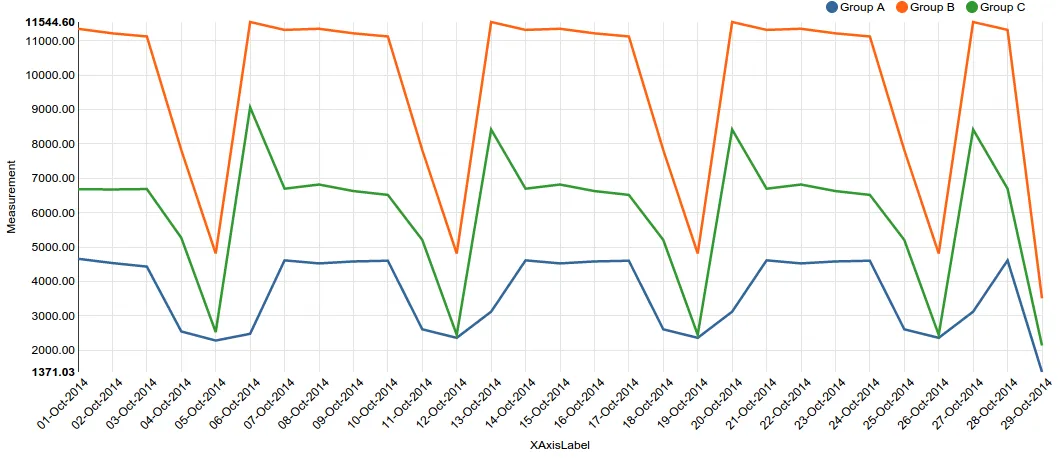
但是似乎NVD3会自动隐藏X轴上一些刻度标签,只有那些靠近边缘的刻度,例如10月2-3日和27-28日(除了第一个和最后一个刻度)。我知道这是自动减少的结果,因为当我增加图表的宽度时,这些刻度开始出现。然而,我认为这种减少行为很奇怪,而且lineChart没有像multiBarChart那样的reduceXTicks选项。

我希望能够像这个一样自己控制减少行为:

var chart = nv.models.lineChart()       
   .useInteractiveGuideline(true)
   .margin({left: 80,top: 20,bottom: 120,right: 20});  

chart.xAxis.ticks(function() {
   return data[0].map(chart.x()).filter(function(d,i) {
      i % Math.ceil(data[0].values.length / (availableWidth / 100)) === 0;
   })
})

但是它没有起作用。有人有任何想法如何控制这个吗? 缺少勾号标签

1
使用.tickValues()代替.ticks() - Lars Kotthoff
我之前尝试过使用.tickFormat(),但它会在上面缺失的刻度标签上添加一个过滤器。此外,当使用这个技巧时,隐藏的标签甚至不会出现在工具提示中。我相信tickValues()会有相同的结果。 - yonasstephen
嗯,我会在x轴上使用时间刻度 - 这应该能让你更好地控制显示内容。这个问题对此非常有帮助:https://dev59.com/bGYq5IYBdhLWcg3w8lNo - Lars Kotthoff
2个回答

19
降低行为之所以起作用,是因为默认情况下 showMaxMin 被设置为 true。添加 .showMaxMin(false) 可以解决这个问题:
chart.xAxis.axisLabel("XAxisLabel")
    .showMaxMin(false)    
    .tickValues(tickvalues)        
    .tickFormat(function (d) {
      return tickformat[d];
      })
;

输入图片说明


注意不要有任何超出范围的刻度值,否则它们将出现在y轴左侧。您还可以使用xDomain来设置x轴的范围。 - Simon_Weaver
这个问题一直困扰着我,感谢你提供的解决方案! - Jérôme Herry

0

如果你想同时拥有边界标记和靠近边界(MaxMin)的标记,你可以修改源代码。

在 nv.models.axis() 中,当 bottom 或 top 方向的 showMaxMin 为 true 时,会提供一个缓冲区:

if (showMaxMin && (axis.orient() === 'top' || axis.orient() === 'bottom')) {
            var maxMinRange = [];
            wrap.selectAll('g.nv-axisMaxMin')
                .each(function(d,i) {
                   try {
                        if (i) // i== 1, max position
                            maxMinRange.push(scale(d) - this.getBoundingClientRect().width - 4);  //assuming the max and min labels are as wide as the next tick (with an extra 4 pixels just in case)
                        else // i==0, min position
                            maxMinRange.push(scale(d) + this.getBoundingClientRect().width + 4)
                    }catch (err) {
                        if (i) // i== 1, max position
                            maxMinRange.push(scale(d) - 4);  //assuming the max and min labels are as wide as the next tick (with an extra 4 pixels just in case)
                        else // i==0, min position
                            maxMinRange.push(scale(d) + 4);
                    }
                });
            // the g's wrapping each tick
            g.selectAll('g').each(function(d, i) {
                if (scale(d) < maxMinRange[0] || scale(d) > maxMinRange[1]) {
                    if (d > 1e-10 || d < -1e-10) // accounts for minor floating point errors... though could be problematic if the scale is EXTREMELY SMALL
                        d3.select(this).remove();
                    else
                        d3.select(this).select('text').remove(); // Don't remove the ZERO line!!
                }
            });
}

我刚刚移除了这些缓冲区:

try {
        if (i) // i== 1, max position
            maxMinRange.push(scale(d));
        else // i==0, min position
            maxMinRange.push(scale(d))
 }catch (err) {
         if (i) // i== 1, max position
              maxMinRange.push(scale(d));
         else // i==0, min position
              maxMinRange.push(scale(d));
 }

网页内容由stack overflow 提供, 点击上面的
可以查看英文原文,
原文链接