我如何在Android应用程序中以编程方式查找使用的内存?
希望有一种方法可以做到这一点。此外,如何获取手机的可用内存?
我如何在Android应用程序中以编程方式查找使用的内存?
希望有一种方法可以做到这一点。此外,如何获取手机的可用内存?
ActivityManager.getMemoryInfo() 是我们用来查看整体内存使用情况的最高级别API。这主要是为了帮助应用程序估计系统是否接近没有更多内存来运行后台进程,因此需要开始终止像服务这样的必需进程。对于纯Java应用程序来说,这应该没什么用处,因为Java堆限制部分是为了避免一个应用程序能够将系统压力提升到这一点。从2.0版本开始,还有一个API可以获取另一个进程的信息:ActivityManager.getProcessMemoryInfo:ActivityManager.getProcessMemoryInfo(int[])。
这将返回一个低级别的MemoryInfo结构体,其中包含所有这些数据:
    /** The proportional set size for dalvik. */
    public int dalvikPss;
    /** The private dirty pages used by dalvik. */
    public int dalvikPrivateDirty;
    /** The shared dirty pages used by dalvik. */
    public int dalvikSharedDirty;

    /** The proportional set size for the native heap. */
    public int nativePss;
    /** The private dirty pages used by the native heap. */
    public int nativePrivateDirty;
    /** The shared dirty pages used by the native heap. */
    public int nativeSharedDirty;

    /** The proportional set size for everything else. */
    public int otherPss;
    /** The private dirty pages used by everything else. */
    public int otherPrivateDirty;
    /** The shared dirty pages used by everything else. */
    public int otherSharedDirty;
但是在Pss,PrivateDirty和SharedDirty之间的区别是什么...现在有趣的事情开始了。
在Android(以及Linux系统总体上)中,许多内存实际上是跨多个进程共享的。因此,进程使用多少内存真的不清楚。再加上向磁盘分页(更不用说我们在Android上不使用的交换),这就更不清楚了。
因此,如果您将映射到每个进程中的所有物理RAM都加起来,并累加所有进程,您可能会得到比实际总RAM大得多的数字。
Pss数字是内核计算的一个度量标准,考虑了内存共享-基本上是进程中每个RAM页面按其他进程也使用该页面的数量的比例进行缩放。通过这种方式,您可以(理论上)将所有进程的pss相加以查看它们正在使用的总RAM,并比较进程之间的pss以了解它们的相对权重。
这里的另一个有趣指标是PrivateDirty,它基本上是进程内无法分页到磁盘的RAM数量(它不由磁盘上的相同数据支持),并且不与任何其他进程共享。另一种看待这个问题的方式是,当该进程消失时将为系统提供可用RAM(并且可能会迅速纳入缓存和其他用途)。
这基本上是用于此的SDK API。但是作为开发人员,您可以在设备上做更多事情。
使用adb,您可以获取有关运行系统的内存使用情况的大量信息。常见的命令是adb shell dumpsys meminfo,它将输出有关每个Java进程的内存使用情况的大量信息,包括上述信息以及各种其他信息。您还可以添加单个进程的名称或pid,例如adb shell dumpsys meminfo system,以查看系统进程:** pid 890 [system]中的MEMINFO **
native dalvik other total
size: 10940 7047 N/A 17987
allocated: 8943 5516 N/A 14459
free: 336 1531 N/A 1867
(Pss): 4585 9282 11916 25783
(shared dirty): 2184 3596 916 6696
(priv dirty): 4504 5956 7456 17916
对象
Views: 149 ViewRoots: 4
AppContexts: 13 Activities: 0
Assets: 4 AssetManagers: 4
Local Binders: 141 Proxy Binders: 158
Death Recipients: 49
OpenSSL Sockets: 0
SQL
heap: 205 dbFiles: 0
numPagers: 0 inactivePageKB: 0
activePageKB: 0
顶部部分是主要部分,在其中size是特定堆的地址空间中的总大小,allocated是堆认为它拥有的实际分配的kb,free是堆剩余的kb,可用于其他分配,pss和priv dirty与之前讨论过的每个堆关联的页面相同。
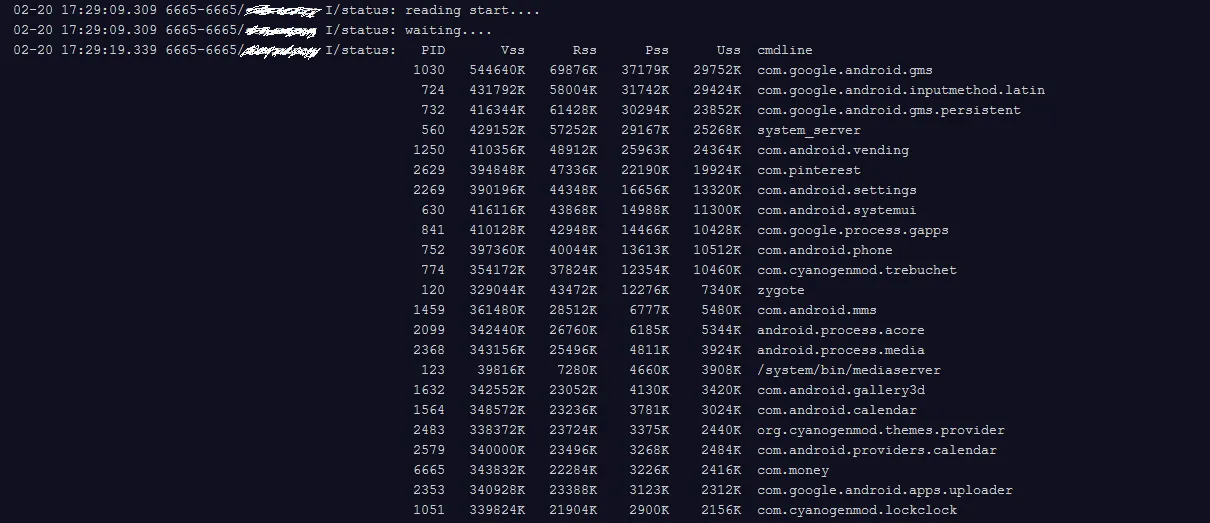
如果您只想查看所有进程的内存使用情况,则可以使用命令adb shell procrank。在同一系统上的输出如下:
  PID      Vss      Rss      Pss      Uss  cmdline
  890   84456K   48668K   25850K   21284K  系统服务器
 1231   50748K   39088K   17587K   13792K  com.android.launcher2
  947   34488K   28528K   10834K    9308K  com.android.wallpaper
  987   26964K   26956K    8751K    7308K  com.google.process.gapps
  954   24300K   24296K    6249K    4824K  com.android.phone
  948   23020K   23016K    5864K    4748K  com.android.inputmethod.latin
  888   25728K   25724K    5774K    3668K  zygote
  977   24100K   24096K    5667K    4340K  android.process.acore
...
   59     336K     332K      99K      92K  /system/bin/installd
   60     396K     392K      93K      84K  /system/bin/keystore
   51     280K     276K      74K      68K  /system/bin/servicemanager
   54     256K     252K      69K      64K  /system/bin/debuggerd
这里的Vss和Rss列基本上是噪音(它们是进程的直接地址空间和RAM使用情况,如果你将跨进程的RAM使用情况相加,你会得到一个非常大的数字)。
Pss就像我们以前看到的那样,而Uss是Priv Dirty。
有趣的事情在于:这里的Pss和Uss与我们在meminfo中看到的略有不同。为什么?因为procrank使用了与meminfo不同的内核机制来收集数据,它们给出的结果略微有所不同。为什么?老实说,我不知道。我相信procrank可能更准确......但真的,这只是一个重要的观点:“以谷粒大小的方式获取任何内存信息;通常一种非常大的谷粒。”
最后有一个命令adb shell cat /proc/meminfo,它给出了系统整体内存使用情况的摘要。这里有很多数据,只有前面几个数字值得讨论(对于其余的数字,只有少数人理解,我询问这些少数人时经常得到相互矛盾的解释):
MemTotal:         395144 kB
MemFree:          184936 kB
Buffers:             880 kB
Cached:            84104 kB
SwapCached:            0 kB
< p >
MemTotal 是内核和用户空间可以使用的总内存量(通常比设备实际物理RAM少,因为一些RAM需要用于无线电、DMA缓冲区等)。
MemFree 是未被使用的RAM量。你看到的数字非常高;在Android系统上,这通常只有几MB,因为我们尝试使用可用内存来保持进程运行。
Cached 是用于文件系统缓存和其他类似内容的RAM。典型系统需要大约20MB来避免进入不良分页状态;Android的内存杀手被调整为特定的系统,以确保在缓存RAM被过多消耗之前,后台进程被终止。
是的,您可以通过编程方式获取内存信息,并决定是否执行内存密集型工作。
调用以下方法来获取VM堆大小:
Runtime.getRuntime().totalMemory();
通过调用此函数获取分配的虚拟机内存:
Runtime.getRuntime().totalMemory() - Runtime.getRuntime().freeMemory();
通过调用此方法获取VM堆大小限制:
Runtime.getRuntime().maxMemory()
通过调用以下方式获取本地分配的内存:
Debug.getNativeHeapAllocatedSize();
我开发了一个应用程序,可以帮助您查明OutOfMemoryError的行为并监视内存使用情况。
https://play.google.com/store/apps/details?id=net.coocood.oomresearch
您可以在https://github.com/coocood/oom-research获取源代码。
这是一项正在进行中的工作,但这是我不理解的内容:
ActivityManager activityManager = (ActivityManager) context.getSystemService(ACTIVITY_SERVICE);
MemoryInfo memoryInfo = new ActivityManager.MemoryInfo();
activityManager.getMemoryInfo(memoryInfo);

Log.i(TAG, " memoryInfo.availMem " + memoryInfo.availMem + "\n" );
Log.i(TAG, " memoryInfo.lowMemory " + memoryInfo.lowMemory + "\n" );
Log.i(TAG, " memoryInfo.threshold " + memoryInfo.threshold + "\n" );

List<RunningAppProcessInfo> runningAppProcesses = activityManager.getRunningAppProcesses();

Map<Integer, String> pidMap = new TreeMap<Integer, String>();
for (RunningAppProcessInfo runningAppProcessInfo : runningAppProcesses)
{
    pidMap.put(runningAppProcessInfo.pid, runningAppProcessInfo.processName);
}

Collection<Integer> keys = pidMap.keySet();

for(int key : keys)
{
    int pids[] = new int[1];
    pids[0] = key;
    android.os.Debug.MemoryInfo[] memoryInfoArray = activityManager.getProcessMemoryInfo(pids);
    for(android.os.Debug.MemoryInfo pidMemoryInfo: memoryInfoArray)
    {
        Log.i(TAG, String.format("** MEMINFO in pid %d [%s] **\n",pids[0],pidMap.get(pids[0])));
        Log.i(TAG, " pidMemoryInfo.getTotalPrivateDirty(): " + pidMemoryInfo.getTotalPrivateDirty() + "\n");
        Log.i(TAG, " pidMemoryInfo.getTotalPss(): " + pidMemoryInfo.getTotalPss() + "\n");
        Log.i(TAG, " pidMemoryInfo.getTotalSharedDirty(): " + pidMemoryInfo.getTotalSharedDirty() + "\n");
    }
}
Hackbod的回答是Stack Overflow上最好的回答之一。它阐明了一个非常晦涩的主题。它对我有很大帮助。
另一个非常有帮助的资源是这个必看视频:Google I/O 2011: Android应用程序内存管理
更新:
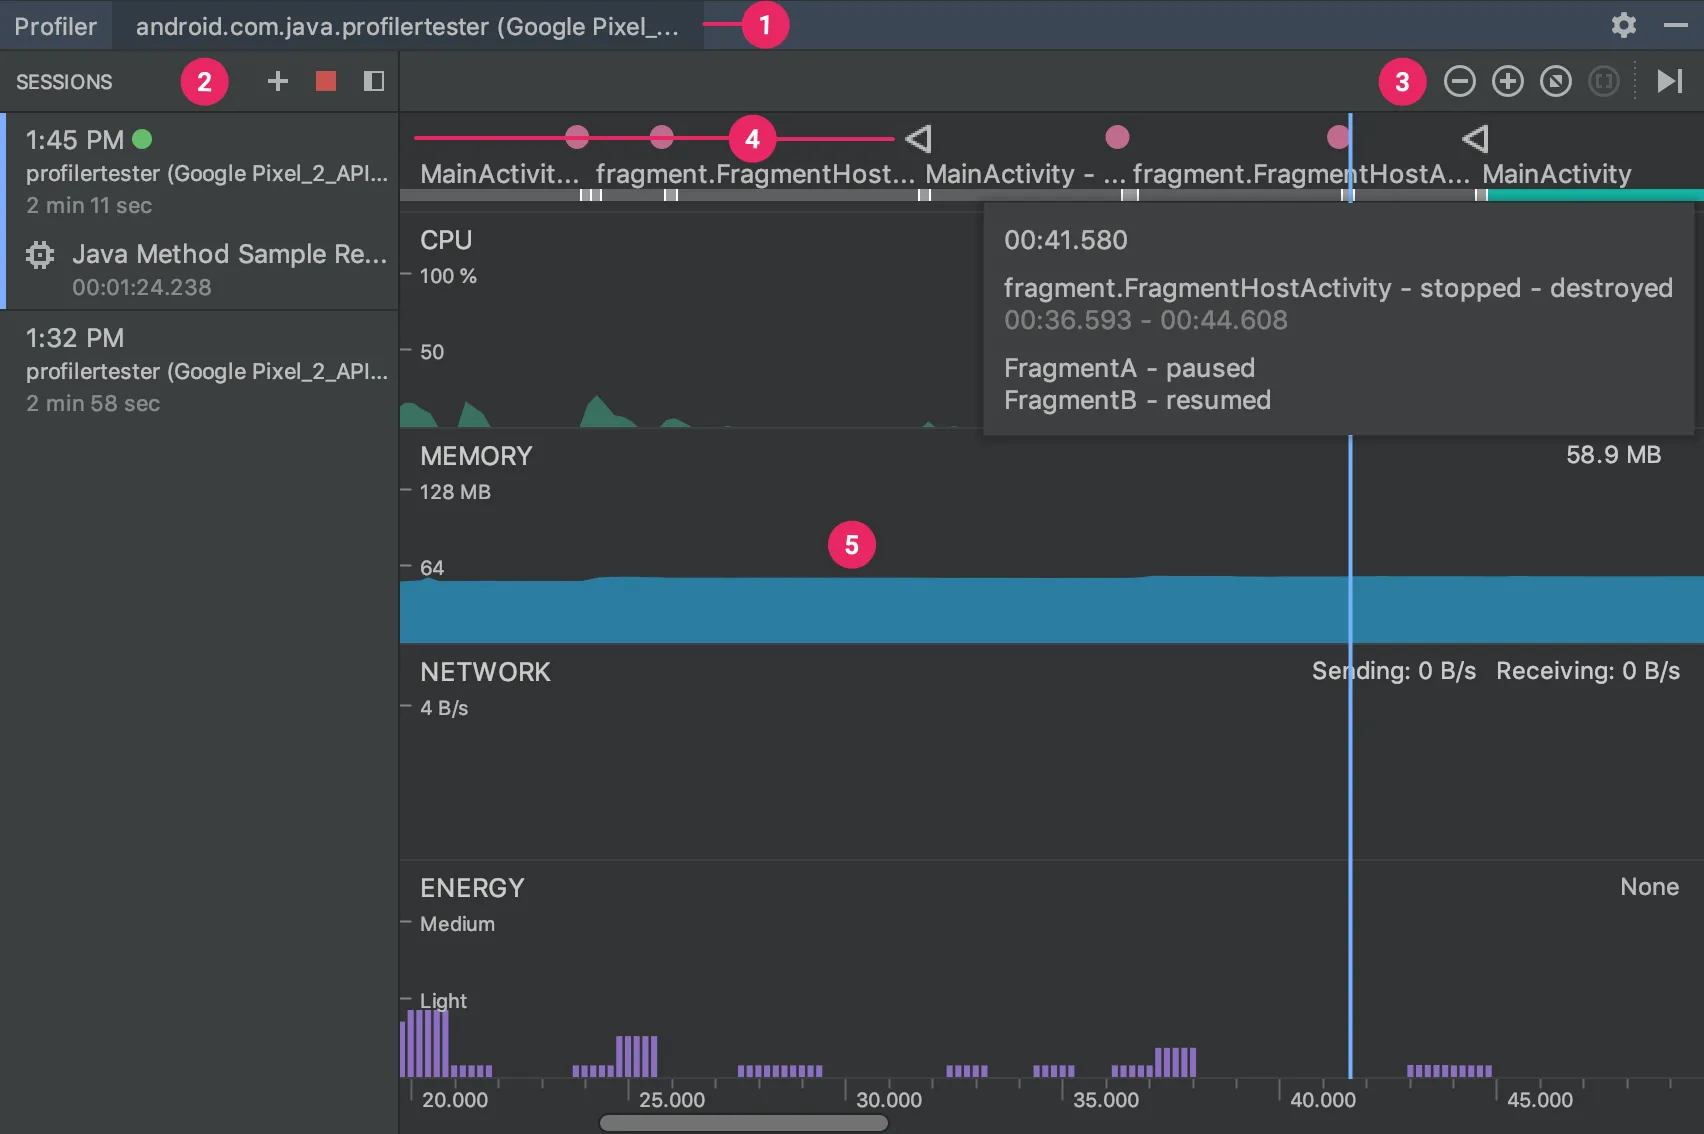
Process Stats是一种服务,可以发现您的应用程序如何管理内存,Dianne Hackborn在博客文章Process Stats:了解您的应用程序如何使用RAM中进行了解释:
Android Studio 0.8.10+引入了一个非常有用的工具,名为Memory Monitor。
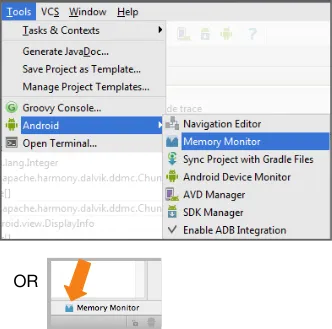
它的作用:
- 以图表形式显示可用内存和已使用内存,以及随时间变化的垃圾回收事件。
- 快速检测应用程序是否因过多的垃圾回收事件而变慢。
- 快速检测应用程序是否因内存不足而崩溃。
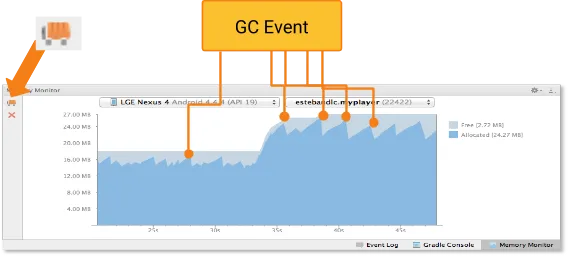
图1. 在Android Memory Monitor上强制进行GC(Garbage Collection)事件
使用此工具可以实时获得应用程序RAM消耗率方面的很好信息。
1) 我猜不行,至少从Java上不行。
2)
ActivityManager activityManager = (ActivityManager) getSystemService(ACTIVITY_SERVICE);
MemoryInfo mi = new MemoryInfo();
activityManager.getMemoryInfo(mi);
Log.i("memory free", "" + mi.availMem);
Runtime.getRuntime().totalMemory(): 仅返回JVM内存
- ActivityManager.getMemoryInfo()、Process.getFreeMemory() 和其他基于 /proc/meminfo 的方法 - 返回有关所有进程组合的内存信息(例如android_util_Process.cpp)
- Debug.getNativeHeapAllocatedSize() - 使用 mallinfo(),仅返回由 malloc() 和相关函数执行的内存分配信息(请参见android_os_Debug.cpp)
- Debug.getMemoryInfo() - 可以完成任务,但速度太慢。在 Nexus 6 上单次调用大约需要 200ms。性能开销使得这个函数对我们来说毫无用处,因为我们会经常调用它,而每次调用都很明显(请参见android_os_Debug.cpp)
- ActivityManager.getProcessMemoryInfo(int[]) - 在内部调用了 Debug.getMemoryInfo()(请参见ActivityManagerService.java)const long pageSize = 4 * 1024; //`sysconf(_SC_PAGESIZE)`
string stats = File.ReadAllText("/proc/self/statm");
var statsArr = stats.Split(new [] {' ', '\t', '\n'}, 3);
if( statsArr.Length < 2 )
throw new Exception("Parsing error of /proc/self/statm: " + stats);
return long.Parse(statsArr[1]) * pageSize;
Debug.MemoryInfo memInfo = new Debug.MemoryInfo();
Debug.getMemoryInfo(memInfo);
long res = memInfo.getTotalPrivateDirty();

if (Build.VERSION.SDK_INT >= Build.VERSION_CODES.KITKAT)
    res += memInfo.getTotalPrivateClean();

return res * 1024L;
我在阅读答案时感到困惑,所以决定阅读文档。
您可以使用Debug对象获取设备的本地堆内存大小:
long nativeTotal = Debug.getNativeHeapSize();
long nativeFree = Debug.getNativeHeapFreeSize();
long nativeAllocated = Debug.getNativeHeapAllocatedSize();
long nativeUsed = nativeTotal - nativeFree;
nativeUsed和nativeAllocated具有相同的值。
使用应用程序的Runtime对象来计算内存使用情况,每个应用程序都有一个运行时对象来访问其接口:
Runtime runtime = Runtime.getRuntime();
long runtimeMax = runtime.maxMemory();
long runtimeTotal = runtime.totalMemory();
long runtimeFree = runtime.freeMemory();
long runtimeUsed = runtimeTotal - runtimeFree;
您可以使用ActivityManager.MemoryInfo对象获取系统的内存使用情况:
ActivityManager activityManager = (ActivityManager) getSystemService(ACTIVITY_SERVICE);
ActivityManager.MemoryInfo memoryInfo = new ActivityManager.MemoryInfo();
activityManager.getMemoryInfo(memoryInfo);
long systemTotal = memoryInfo.totalMem;
long systemFree = memoryInfo.availMem;
long systemUsed = systemTotal - systemFree;
读取系统内存使用情况的另一种方法是通过解析Linux中/proc/meminfo文件的内容。
RandomAccessFile reader = new RandomAccessFile("/proc/meminfo", "r");
Pattern pattern = Pattern.compile("(\\d+)");
Matcher totalMatcher = pattern.matcher(reader.readLine());
totalMatcher.find();
long procTotal = Long.parseLong(totalMatcher.group(1)) * 1024L; // KB to B
Matcher freeMatcher = pattern.matcher(reader.readLine());
freeMatcher.find();
long procFree = Long.parseLong(freeMatcher.group(1)) * 1024L; // KB to B
long procUsed = procTotal - procFree;
好的,我还是有些困惑。但这些都是获取内存使用情况的方法。将它们全部记录下来以调试应用程序!!!
我还为每个方法提供了一个链接,以便阅读其使用和信息。
以上有很多答案肯定会帮到你,但是经过两天的努力和研究adb内存工具后,我认为我也能发表我的观点。
正如Hackbod所说:因此,如果您将实际映射到每个进程中的所有物理RAM相加,并将所有进程相加,您可能会得到一个比实际总RAM大得多的数字。,所以没有办法获得每个进程的确切内存量。
但是您可以通过一些逻辑来接近它..我将告诉您如何做。
首先,您需要成为root用户才能使其工作。通过在进程中执行像
android.os.Debug.MemoryInfo和ActivityManager.getMemoryInfo()这样的API已经被提到并使用过,但我将讨论其他方法。
su以root权限进入控制台,并获取其输出和输入流。然后将id\n(回车)传递到输出流中并将其写入进程输出,如果得到包含uid=0的输入流,则您是root用户。
现在这里是您将在上述过程中使用的逻辑
当您获得进程的输出流时,用\n代替id传递您的命令(procrank、dumpsys meminfo等),并获取其输入流并读取,将流存储在bytes[]、char[]等中,使用原始数据..就完成了!!!
权限:
<uses-permission android:name="android.permission.FACTORY_TEST"/>
检查是否为root用户:
// su command to get root access
Process process = Runtime.getRuntime().exec("su");
DataOutputStream dataOutputStream =
                           new DataOutputStream(process.getOutputStream());
DataInputStream dataInputStream =
                           new DataInputStream(process.getInputStream());
if (dataInputStream != null && dataOutputStream != null) {
   // write id to console with enter
   dataOutputStream.writeBytes("id\n");
   dataOutputStream.flush();
   String Uid = dataInputStream.readLine();
   // read output and check if uid is there
   if (Uid.contains("uid=0")) {
      // you are root user
   }
}
使用su命令执行您的指令。
Process process = Runtime.getRuntime().exec("su");
DataOutputStream dataOutputStream =
                           new DataOutputStream(process.getOutputStream());
if (dataOutputStream != null) {
 // adb command
 dataOutputStream.writeBytes("procrank\n");
 dataOutputStream.flush();
 BufferedInputStream bufferedInputStream =
                     new BufferedInputStream(process.getInputStream());
 // this is important as it takes times to return to next line so wait
 // else you with get empty bytes in buffered stream
 try {
       Thread.sleep(10000);
 } catch (InterruptedException e) {
       e.printStackTrace();
 }
 // read buffered stream into byte,char etc.
 byte[] bff = new byte[bufferedInputStream.available()];
 bufferedInputStream.read(bff);
 bufferedInputStream.close();
 }
}
日志记录:
您从控制台获得了一个原始数据字符串,而不是从任何API的实例中获取,这会导致存储复杂,因为您需要手动分离它。
这只是一次尝试,请告诉我是否有遗漏之处。