一个FITS文件的坐标转换问题

3
我已经在python中加载并绘制了一个FITS文件。 在之前的帖子的帮助下,我成功地将轴从像素转换为天文坐标。但是我无法正确地将它们转换为毫角秒(mas)。 以下是代码:
import numpy as np
import matplotlib.pyplot as plt
import astropy.units as u
from astropy.wcs import WCS
from astropy.io import fits
from astropy.utils.data import get_pkg_data_filename

filename = get_pkg_data_filename('hallo.fits')


hdu = fits.open(filename)[0]
wcs = WCS(hdu.header).celestial
wcs.wcs.crval = [0,0]

plt.subplot(projection=wcs) 
plt.imshow(hdu.data[0][0], origin='lower') 
plt.xlim(200,800)
plt.ylim(200,800)
plt.xlabel('Relative R.A ()')
plt.ylabel('Relative Dec ()')
plt.colorbar()

输出结果如下图所示: enter image description here 
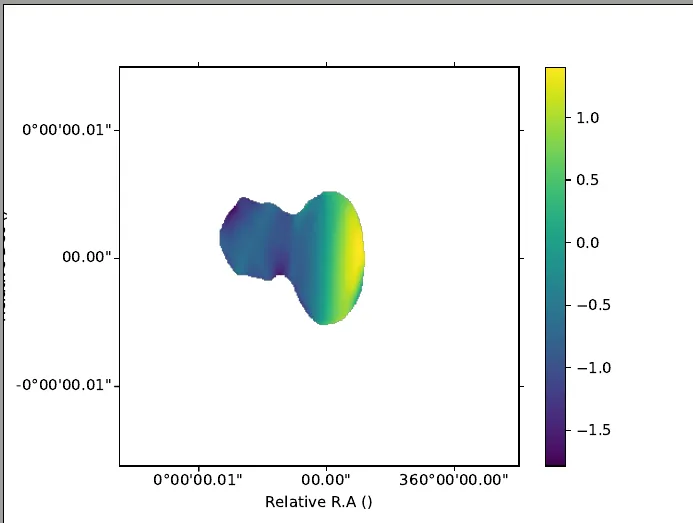
y轴标签因某种原因被切掉了,我不知道为什么。
正如在另一篇帖子中所示,可以使用
wcs.wcs.ctype = [ 'XOFFSET' , 'YOFFSET' ]

将其转换为毫秒,并得到结果:

enter image description here

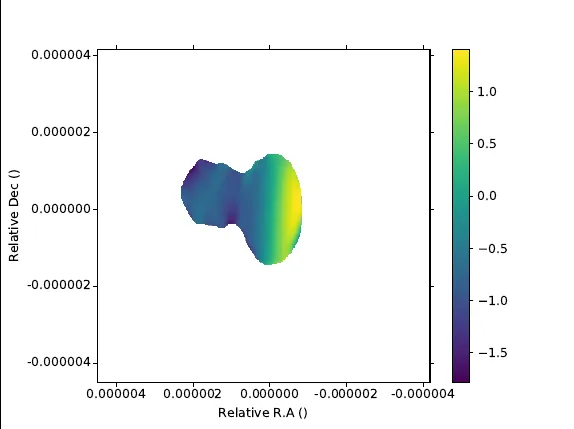
但比例尺不正确!例如,0度00分00.02秒应该是20毫角秒,而不是0.000002!我有遗漏什么吗?


通过包含plt.tight_layout()行,您很可能解决y标签被切断的问题。 - zabop
真的,添加fig = plt.figure(figsize=(在这里添加你的尺寸))也有帮助。 - Wara
1个回答

0

看起来像是一个光谱指数图。不错! 我认为问题可能在于FITS隐式地使用度数作为CDELT等值的单位。它们应该明确地转换为毫角秒以进行绘制。 最直接的方法是将CDELT值乘以3.6e6,以从度数转换为毫角秒。 然而,如果您想在某个时候转换为不同的单位,则有一种更通用的方法可能会有用:

import astropy.units as u
w.wcs.cdelt = (w.wcs.cdelt * u.deg).to(u.mas)

它基本上首先说明CDELT的单位是度,然后将其转换为毫秒。

整个工作流程如下:

def make_transform(f):
    '''use already read-in FITS file object f to build pixel-to-mas transformation'''
    print("Making a transformation out of a FITS header")

    w = WCS(f[0].header)
    w = w.celestial
    
    w.wcs.crval = [0, 0]
    w.wcs.ctype = [ 'XOFFSET' , 'YOFFSET' ]
    w.wcs.cunit = ['mas' , 'mas']
    w.wcs.cdelt = (w.wcs.cdelt * u.deg).to(u.mas)
    print(w.world_axis_units)
    return w

def read_fits(file):
    '''read fits file into object'''
    try:
        res =  fits.open(file)
        return res
    except:
        return None

def start_plot(i,df=None, w=None, xlim = [None, None], ylim=[None, None]):
    '''starts a plot and returns fig,ax .
    xlim, ylim - axes limits in mas
    '''
       
    # make a transformation
    # Using a dataframe
    if df is not None:
        w = make_transform_df(df)         
    # using a header    
    if w is not None:
        pass
    # not making but using one from the arg list
    else:
        w = make_transform(i)

#    print('In start_plot using the following transformation:\n {}'.format(w))


    fig = plt.figure()
    
    if w.naxis == 4:
        ax = plt.subplot(projection = w, slices = ('x', 'y', 0 ,0 ))
    elif w.naxis == 2:
        ax = plt.subplot(projection = w)
        
    
    # convert xlim, ylim to coordinates of BLC and TRC, perform transformation, then return back to xlim, ylim in pixels
    if any(xlim) and any(ylim):
        xlim_pix, ylim_pix = limits_mas2pix(xlim, ylim, w)
        ax.set_xlim(xlim_pix)
        ax.set_ylim(ylim_pix)
        
    
    fig.add_axes(ax)  # note that the axes have to be explicitly added to the figure
    return fig, ax 


rm = read_fits(file)
wr = make_transform(rm)
fig, ax = start_plot(RM, w=wr, xlim = xlim, ylim = ylim)

然后只需使用imshow或contours等将其绘制到轴ax上。 当然,此代码可以缩减以满足您特定的需求。


1
谢谢Mikhail。我的问题已经解决了,一个朋友建议添加lon = ax.coords [0] lat = ax.coords [1]。现在,它可以在最新的Python版本中正常工作。 - Wara

网页内容由stack overflow 提供, 点击上面的
可以查看英文原文,
原文链接