我对
subplot的工作方式还不太清楚。具体而言,在MATLAB中subplot(121)和subplot(1,2,1)之间有什么区别?我尝试搜索了subplot文档,但似乎没有找到我要找的内容。subplot的工作方式还不太清楚。具体而言,在MATLAB中subplot(121)和subplot(1,2,1)之间有什么区别?我尝试搜索了subplot文档,但似乎没有找到我要找的内容。简而言之,它们没有区别。 subplot 的工作方式如下:
subplot(m,n,p); %//or
subplot(mnp);
subplot中。 subplot将多个图形放置在同一个窗口中。您可以将绘图放置在m x n网格中,其中m包含图形中的行数,n包含列数。 p决定了您想要在网格中放置绘图的位置。数字p从1递增到m x n,并且绘图从左到右,从上到下放置。subplot(1,2,1)或subplot(121)时,您希望有一行和两列的图像。 最后一个数字p=1表示您希望将绘图放置在最左侧的列中。 当您执行subplot(1,2,2)或subplot(122)时,此时p=2,您希望将绘图放置在最右侧的列中。subplot的方法如下:m和n)。
2.生成一个空的figure窗口。
3.对于每个要创建的绘图...subplot并选择您希望绘图出现的正确位置。
- 编写必要的代码,像您为仅占用单个窗口的绘图一样。
- 绘制你的数据subplot位置。figure;
rng(10); %// Set seed for reproducibility
subplot(2,3,1);
x = rand(100,1);
y = rand(100,1);
plot(x,y,'b.');
title('First plot');
subplot(2,3,2);
x = rand(100,1);
y = rand(100,1);
plot(x,y,'b.');
title('Second plot');
subplot(2,3,3);
x = rand(100,1);
y = rand(100,1);
plot(x,y,'b.');
title('Third plot');
subplot(2,3,4);
x = rand(100,1);
y = rand(100,1);
plot(x,y,'b.');
title('Fourth plot');
subplot(2,3,5);
x = rand(100,1);
y = rand(100,1);
plot(x,y,'b.');
title('Fifth plot');
subplot(2,3,6);
x = rand(100,1);
y = rand(100,1);
plot(x,y,'b.');
title('Sixth plot');
 您还可以为p指定一个向量。但是,如果使用这种方式,则必须以以下方式调用subplot:subplot(m,n,p);如果p是单个数字,则subplot(m,n,p);或subplot(mnp)都可以正常工作。
figure;
rng(10); %// Set seed for reproducibility
subplot(2,3,1:3);
x = rand(100,1);
y = rand(100,1);
plot(x,y,'b.');
title('First plot');
subplot(2,3,4:5);
x = rand(100,1);
y = rand(100,1);
plot(x,y,'b.');
title('Second plot');
subplot(2,3,6);
x = rand(100,1);
y = rand(100,1);
plot(x,y,'b.');
title('Third plot');
这张图的样子如下:
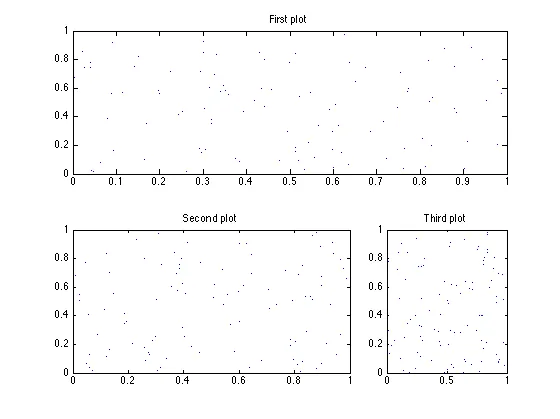
如您所见,我们使用subplot(2,3,1:3);在第一行用第一个图占据了第一行。第二个图占据了p=4,p=5的位置,使用了subplot(2,3,4:5);。它占据了第二行的第一列和第二列。最后,我们的最后一个图占据了第二行的第三列,使用了subplot(2,3,6);。请记住,描绘区域从左到右、从上到下,而且p不仅可以是单个数字,还可以是向量。如果您想占据前两行和前两列,则应该使用subplot(2,3,[1 2 4 5]);。现在,如果您想占据整个最右边的列,您可以使用subplot(2,3,[3 6]);,或者如果您只想要最右边列的顶部位置,则可以使用subplot(2,3,3);或subplot(233);,然后如果您想处理最后一列和最下面最右边的位置,您可以使用subplot(2,3,6);或subplot(236);。
最后要确保记住的一件事是,您需要在决定显示图形之前调用subplot。一旦完成,切换到下一个位置继续工作。
希望这可以帮助你!祝你好运!