SAS:如何自动计算PROC FREQ中的组合?

3

我有一个患者数据集,看起来像下面的表格,我想知道哪些疾病会同时出现并最终制作一张热力图。我使用了PROC FREQ来制作这个列表,但是这样处理太费时间了,因为它给出了每种组合(成千上万种)。

Moya    Hypothyroid Hyperthyroid    Celiac
   1       1           0             0
   1       1           0             0       
   0       0           1             1
   0       0           0             0
   1       1           0             0
   1       0           1             0
   1       1           0             0
   1       1           0             0
   0       0           1             1
   0       0           1             1


proc freq data=new;
tables HOHT*HOGD*CroD*Psor*Viti*CelD*UlcC*AddD*SluE*Rhea*PerA/list;
run;

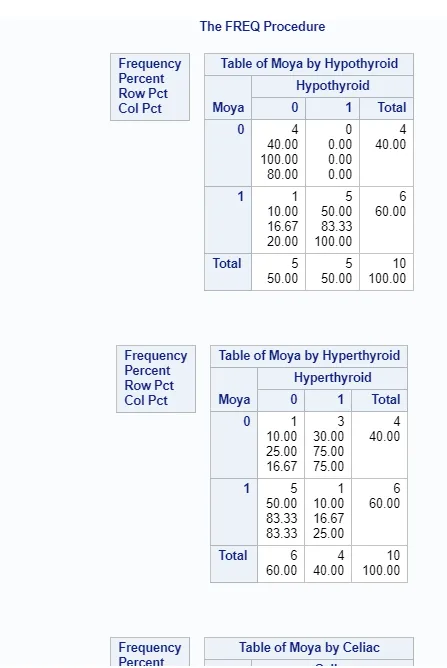
最终我希望能够得到一堆交叉表格,如下所示,以便我可以看到每种组合有多少患者。显然,手动复制粘贴每个变量是可能的,但是否有任何快速查看或自动化此过程的方法呢?

proc freq data=new;
tables HOHT*HOGD/list;
run;

proc freq data=new;
tables HOHT*CroD/list;
run;


proc freq data=new;
tables HOHT*Psor/list;
run;

谢谢!

2个回答

3

使用TABLES语句可以控制在PROC FREQ中生成的表格。要生成数据集中所有列的2向列联表,可以编写一个SAS宏,循环遍历变量列表,并生成TABLES语句来创建所有正确的列联表。

例如,使用原帖子中的数据:

data xtabs;
input Moya    Hypothyroid Hyperthyroid    Celiac;
datalines;
   1       1           0             0
   1       1           0             0       
   0       0           1             1
   0       0           0             0
   1       1           0             0
   1       0           1             0
   1       1           0             0
   1       1           0             0
   0       0           1             1
   0       0           1             1
;
run;
%macro gentabs(varlist=);
   %let word_count = %sysfunc(countw(&varlist));
   %do i = 1 %to (&word_count - 1);
      tables %scan(&varlist,&i,%str( )) * (
      %do j = %eval(&i + 1) %to &word_count;
        %scan(&varlist,&j,%str( ))
      %end; )
      ; /* end tables statement */
   %end;
%mend;
options mprint;
proc freq data = xtabs;
  %gentabs(varlist=Moya Hypothyroid Hyperthyroid Celiac)
  run;

SAS宏生成的代码如下:
 73         proc freq data = xtabs;
 74           %gentabs(varlist=Moya Hypothyroid Hyperthyroid Celiac)
 MPRINT(GENTABS):   tables Moya * ( Hypothyroid Hyperthyroid Celiac ) ;
 MPRINT(GENTABS):   tables Hypothyroid * ( Hyperthyroid Celiac ) ;
 MPRINT(GENTABS):   tables Hyperthyroid * ( Celiac ) ;
 75         run;

...并且输出的前几个表格如下图所示:

enter image description here

要在TABLES语句中添加选项,需要在注释为/* end tables statement */的分号之前添加代码。


哇,令人印象深刻。非常感谢你。 - ybao
@ybao - 不用谢。SAS宏语言绝对值得学习。一开始可能有点挑战,因为宏语言的输出是SAS代码,但你可以用它做一些非常令人印象深刻的事情。 - Len Greski
也可以编写一个宏来从SAS数据集中提取列名并将其保存到宏变量中,该变量可以用作%gentabs()的参数。 - Len Greski

0

Proc MEANS是一种常用的工具,用于获取数据中组合群体的各种统计信息。在您的情况下,您只需要每个组合的计数。

假设您有10,000名患者,其中包括10个二进制因素。

data patient_factors;
  do patient_id = 1 to 10000;
    array factor(10);
    do _n_ = 1 to dim(factor);
      factor(_n_) = ranuni(123) < _n_/(dim(factor)+3);
    end;
    output;
  end;
  format factor: 4.;
run;

正如您所提到的,Proc FREQ 可以计算每个 10 级组合的计数。

proc freq noprint data=patient_factors;
  table 
    factor1
    * factor2 
      * factor3
        * factor4
          * factor5
            * factor6
              * factor7
                * factor8
                  * factor9
                    * factor10
  / out = pf_10deep
  ;
run;

FREQ 没有语法支持创建包含每个成对组合的输出数据,这些组合涉及 factor1

Proc MEANS 此类输出的语法。

proc means noprint data=patient_factors;
  class factor1-factor10;
  output out=counts_paired_with_factor1 n=n;
  types factor1 * ( factor2 - factor10 );
run;

实际上,PROC FREQ 支持像 TABLES factor1 * (factor2 -- factor10); 这样的语法。请参阅 SAS/STAT 14.3 用户指南第2796页。 - Len Greski
是的,表格确实会创建所有交叉点的ODS输出,但我认为在“FREQ”中通过output=(作为数据)创建的数据集将只包含最后一个解决的交叉点。 - Richard

网页内容由stack overflow 提供, 点击上面的
可以查看英文原文,
原文链接