简介
对于一个格子图的元素大小可以通过多种方式进行缩放。一种方法是更改所有具有cex属性的参数,另一种方法是更改基本fontsize作为绘制的基础。你想要的解决方案是后者,你很快就会看到,但是通过par.settings参数影响单个组件的绘图也是有益的,因为在设置fontsize时可能需要定制应用于单个组件的相对缩放。
tl:dr(总结)
使用@Andrie答案中的示例绘图
require(lattice)
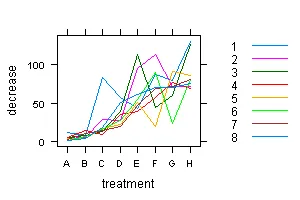
plt <- xyplot(decrease ~ treatment, OrchardSprays, groups = rowpos,
type = "a",
auto.key = list(space = "right", points = FALSE, lines = TRUE))
设置fontsize参数,一个由text和points组成的列表,它定义了这两个关键图形元素的基础尺寸,所有其他图形装饰都是从这两个元素生成的。
update(plt, par.settings = list(fontsize = list(text = 8, points = 4)))

(在150px x 200px的PNG光栅设备上呈现)。
为绘图元素设置单独的cex参数
需要注意的一点是,Lattice图的外观由一系列参数控制,这些参数由trellis.par.get()返回。
> thm <- trellis.par.get()
> str(thm, max = 1)
List of 35
 $ grid.pars        : list()
 $ fontsize         :List of 2
 $ background       :List of 2
 $ panel.background :List of 1
 $ clip             :List of 2
 $ add.line         :List of 4
 $ add.text         :List of 5
 $ plot.polygon     :List of 5
 $ box.dot          :List of 5
 $ box.rectangle    :List of 5
 $ box.umbrella     :List of 4
 $ dot.line         :List of 4
 $ dot.symbol       :List of 5
 $ plot.line        :List of 4
 $ plot.symbol      :List of 6
 $ reference.line   :List of 4
 $ strip.background :List of 2
 $ strip.shingle    :List of 2
 $ strip.border     :List of 4
 $ superpose.line   :List of 4
 $ superpose.symbol :List of 6
 $ superpose.polygon:List of 5
 $ regions          :List of 2
 $ shade.colors     :List of 2
 $ axis.line        :List of 4
 $ axis.text        :List of 5
 $ axis.components  :List of 4
 $ layout.heights   :List of 19
 $ layout.widths    :List of 15
 $ box.3d           :List of 4
 $ par.xlab.text    :List of 5
 $ par.ylab.text    :List of 5
 $ par.zlab.text    :List of 5
 $ par.main.text    :List of 5
 $ par.sub.text     :List of 5
有很多因素会影响注释中所绘制的对象和文本的大小。您需要修改所有相关设置并将其仅作为列表传递给par.settings()。下面是一个例子,演示如何缩放@Andrie的示例图:
CEX <- 0.5

pset <- list(superpose.symbol = list(cex = CEX),
             plot.symbol      = list(cex = CEX),
             par.sub.text     = list(cex = CEX),
             par.main.text    = list(cex = CEX),
             par.zlab.text    = list(cex = CEX),
             par.ylab.text    = list(cex = CEX),
             par.xlab.text    = list(cex = CEX),
             dot.symbol       = list(cex = CEX),
             box.dot          = list(cex = CEX),
             add.text         = list(cex = CEX),
             axis.text        = list(cex = CEX))
plt2 <- update(plt, par.settings = pset)
使用gridExtra包在同一设备上安排两个lattice图形,我们可以看到所有这些效果:
require("gridExtra")
grid.arrange(plt, plt2, ncol = 2)
导致
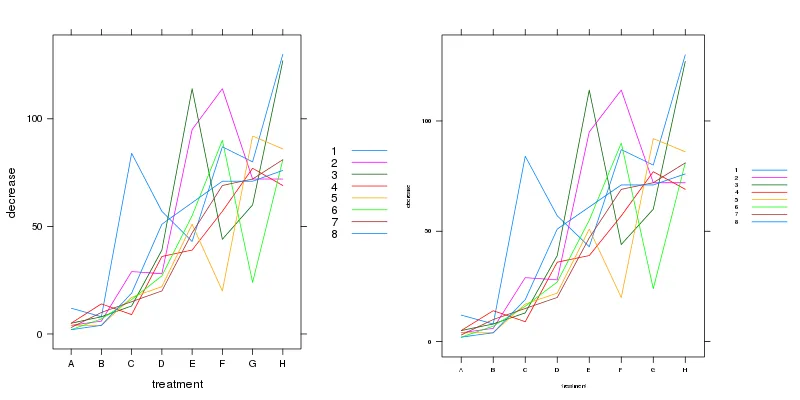
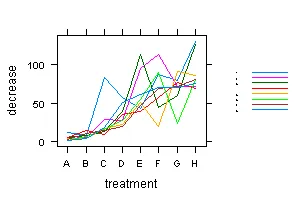
现在(几乎)所有内容都已经被缩放了。有一件有趣的事情需要注意,即这种方法没有缩放图例中线条的长度和刻度线的长度。请注意,每个子图的区域大小都是相同的。但是我们可以在更小的尺寸上绘制整个图形:
这是合理的,并且在基于矢量的设备(例如pdf())上呈现效果将比我必须用来说明的光栅png()更好。第二个图是在150px x 200px的设备上绘制的。
通过设置基础fontsize来控制整体缩放
有一个更简单的方法,那就是通过fontsize参数设置文本和点的基础字体大小。它们的默认值为:
> trellis.par.get("fontsize")
$text
[1] 12

$points
[1] 8
这些会影响图形的所有元素,因此我们可以缩小它们以实现类似于设置所有其他选项的效果。
update(plt, par.settings = list(fontsize = list(text = 8, points = 4)))
该代码将会生成以下图像:
这个图像是在与之前的第二张图相同大小的png()设备上绘制的。请注意边距如何调整,使得绘图更好地缩放。因此,我们不仅影响了我们之前更改的所有设置,还影响了绘图的其他部分(例如间距和刻度标记),它们也从fontsize设置中获取了队列。再次说明,将这些绘制在矢量设备上将会产生更好的输出。